Run-time Tools to aid Application Security Assessments
Show transcript [en]
hey guys so my name is Sasha I work at Gotham digital science I'm a security concept consultant and have been for the last four years I say probably 80% of what I do is web application tests percent of those are blackbox tests so an extreme example of a batbox test we had a client turn around and say we're not going to tell you many web application is I'll tell you what it's like go find it confirm with us that it's what you think it is and then proceed to hack it but typically what it means is that we get given some credentials and we escalate our way up the exploitation paths is some kind of
system compromised so for the last four years I've been performing blackbox tests and it's become quite obvious that that box s a kind of a hangover from the era where we used to hang out in our basements and testings not necessarily with permission the problem with this it's quite obvious after a little while a little bit of testing that we are largely testing blind a lot of what we do is inference based so we inject some kind of input into an application it will give us an output and we'll try and come to some conclusion as to what's happening behind the scenes so the solution to this has been grey box testing so a client will provide us with
source code and say look for a source code I would order it and use it to better channel your blackbox testing so this combination we get a kind of gray box on somewhere in between kind of tests it's slightly more informed in black box testing but it can be problematic a lot of the time we are chasing source code with clients we can spend a good two three days burning time trying to find a right developers different development teams when they do get the source code to us it's not the right version it's not what's going into production problematic and then trying to find the one guy in an organization who knows actually we had to build this
solution is well it's never happened so if we aren't provided with libraries we're chasing our tails a lot of the time so yeah we also got a problem with source code delivery obviously most of the source code is intellectual property a client does not want to leave the site they don't want to send it to you by any kind of external mean so it has been a problem trying to get hold this stuff once on site so what's the other grey box solution it's well I think it's probably using run time tracing technology to skip past this source code necessity and actually have a more reformed look at what's happening whilst we're performing these tests typically
the tools that well a short summary of the available tools are dtrace el trace and ass trace and they're kind of in order of preference if you've got a box that you've got D trace on you you've locked out it's you it's do some research on a tool it's fantastic it's not only allows you to monitor function calls as they're being performed but you can also edit them by its destructive mode I'll trace allows you to trace library calls this is convenient for Lib C star calls so with whenever you want to spot like a dangerous man copy or evaluate Lemkin key copy you're staring copy or any kind of dangerous function you can use that and s trace is kind of
your fallback mechanism if you've got none of these things so if you think about something like a remote file included or local file link let's go with local file include so the easiest way to spot this would be to watch for a sis call open on a file handle and if the argument for the path argument ends up being some kind of data that you control you know you've potentially got a vector for filing field of some sort so what is typical testing look like number one with your request the HTTP request it hits a web server that web service says well it's querying username of PHP so I'm gonna perform a syscall open that
file out read it read the contents out and past that that source code to an interpreter and execute whatever codes in there so let's say that collect could contains a sequel select statement the web server will handle the querying the database via whatever function calls it does and then we get returned some HTML based on this query and response from the sequel server so tracing effectively allows us to interject into an Albert number of these points so that we're not only pumping data in and getting some kind of output out we could actually sit on the web server and say every time a function call is made to to the sequel server and a sequel query is performed tell me
about it so that I can have greater overview of how this application actually functions then every time I could mentioned a sis call was made to open the file tell me about it because I want to know if I can control any of that input so I mentioned some of the tools already DTrace is solaris freebsd OS X and iOS simulator included by default so if you've got other sex start playing with dtrace because it really is like incredible l trace is commonly included in Linux and UNIX vistors and as is s trace if it's not you can get it by package managers quite quickly a space truss so they leverage the P traces call
the puter a Cisco effectively allows a process to gain control of another process and mess about with its internal state this kind of allows us within estrellas trust to log sis calls as they're made by a application and how to describe sis calls so sister calls are basically like the operating system level API so if you want to open a file or do some kind of repetitive tasks that's just too monotonous to do manually leverages AP is the equivalent in Windows is the win32 API or the extensions for 64-bit the difference with El traces allows you to trace library calls again if you want to look at things like buffer overflows and see whenever a dangerous function in
Lipsey's being called you can leverage el trace to give you this kind of printout or always stuff going through it also includes monitoring persist calls logging for Cisco so el trace beat desperates s face always do trace dynamic tracing was developed by sun included in solaris mainly as a kind of performance logging and troubleshooting tool and it's it's it's fantastic in that allows you to step through applications that have probes defined within them and this this is a bit of a hole back in terms of you have to have an app or some kind of service that's had these probes coded within them once you've got these you're actually flying because not only can you
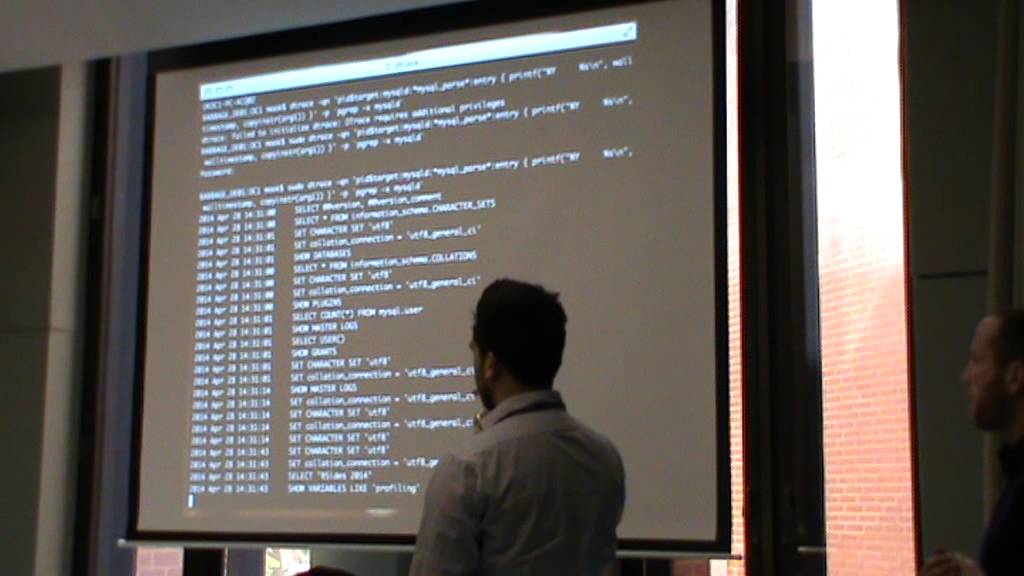
monitor function calls you can actually modify them on the fly so you've got you've got a quick route into in-memory fuzzing and process fuzzing that kind of thing what dtrace looks like in action so QN is effectively quite mode D trace and then the red bit is a target process so we are looking for a my sequel daemon we're looking for a query that's wildcard my sequel pass my critical path is what my sequel calls every time it needs to perform a kind of select insert whatever statement bits in blue are what we do once we have triggered this condition so we want to print out a timestamp and the first argument to the function to my sequel pass and then
we're just wrapping out and passing piping back the PID for my sequel service my signal daemon and the output kind of looks like this so what you have is this is from PHP myadmin you have every single query that is before and once you hit a page right yeah it's typically a lot more queries and we'd think occur in a background so the target read is to look through this and attempt to find something that we potentially control that could be an attack vector but and right at the bottom we've got a select B size 2014 so it indicates that we might have some kind of control of the parameters passed to that select statement therefore we
might have sequel injection but this is a sort of this is very applicable for Apache kind of web app II kind of testing which is why I spend a lot of my time doing so I've kind of focused my research into these tools based around those facts but there's no reason that you can't use these tools to perform just a system-wide kind of blanket coverage of every dangerous function that is called on your system what's calling it and even set to the side so the expected expected buffer size for the arguments and the actual buffer size so it's quite easy to trigger an alert every time you get some kind of buffer overflow condition this is on RS X again
RS x kernel includes the probes that you need to be able to perform this kind of kernel level logging so okay we've got a sequel injection we've got buffer overflows and massive massive issue or one of the hurdles with how we progress to perform blackbox testing on this sort of a gray box testing style is really to define what the heuristics are for different vulnerabilities examples how do you perform cross-site scripting assessments automatically programmatically using tracing tools and it turns out a Firefox is actually actually contains a lot of the dtrace probes you just have to build it with separate flag and you might have an avenue there for hooking into the JavaScript runtime and seeing if there's
any day that you're passing to it you can control or there are simple avenues like every time an application or web server return some outputs every time it's right into socket is it writing any data that we've put in there this idea of monitoring a day that we've put through ends up being actually quiet key to how we how we analyze these large data sets so if you guys use burp it's scanner it you'll see the tag that it generates the kind of like Hoshi ASCII kind of values that are pencil different query so that it knows which requests have ended it ended in which responses the second third order cross-site scripting and that kind of thing so it
can match request response pairs you'd have to pursue the same kind of Avenue so you have to match on token values in vulnerabilities and then say this request has value to this kind of response which means that probably we've got some kind of cross-site scripting or at least a free route to some kind of vulnerability and this is something that needs to be considered actually with all the vulnerability classes is how do we utilize these tools at which point do we evaluate the vulnerability and it's successfully occurring and how do we meaningfully reduce the data set so using D trace or L trace or s trace whatever but at the moment is a client agent and a server agent talks to the
server and it says look I've got all these sis calls and it's in the tens of thousands and terminal quite quickly your terminal buffer will quite quickly fill up because the data set is actually mattered and so you have to be a little bit smarter about what you want to monitor so you have to start reducing things like sis calls down to pertinent sis calls so far handling says calls anything to do with the network if you're at the sort of Wynn API level are we calling any cryptographic api's how those being cooled and then depending on the sequel server database types and web server flavors you cannot actually have to hook different things so there's a kind of learning process to
to employing this technique and then there's more sort of nebulous concepts like how do we test water ization weakness that's quite tough that's a hard problem to solve in this kind of scenario but I don't know some more thought might come up with a solution the issue of how do we then quantify and guarantee coverage so how do we tell say to a client we've here 8% of the functionality within this application and it turns out that that's not quite an easy thing to do and there's that then there's a dependency for the client to a give us access to the server that's running these services be that they've got the tools installed or they will
allow us to install these tools because a lot of the time we tend to test in development environments this isn't too much of a hurdle you just have to talk to the right developer they're quite happy to give you access as long as you don't completely tank the environment but the overall benefits are that really I get a little bit less bored by constant web testing day today I get to think about things on a different sort of different layers which is quite important so my generation got thrown into web app testing and we didn't really escalate up the stack like people are started with networks and then work their way up so we're kind of
merging our way down we're traveling down from the application layer all the way down to the physical stuff and this is quite a beneficial way to learn all that kind of stuff and learn how things function behind the scenes the obvious benefit is this remove source code dependency so if you haven't got supports good at a time you've still got some kind of grey box more enlightened view as to what you are testing more bugs is obviously equivalent to better coverage hopefully and tracing is bigger than web us all right so I restricted disk to web testing but there's absolutely no reason why you can't do something more sophisticated like network security tests a big bug but the bug way I have
is RPC services and I never feel like they're adequately tested or we can sit if we can sit on the same box as a service monitor the kind of critical calls that are being triggered within it what we can do is get a better idea of well how we should proceed with testing and that's that's pretty much it for this talk props go to Matt Hillman and nilz squidgy surname a previous employer they kind of stab me on the D trace route and when they told me about dia trace my kind of mind was blown and it took very long time to sit down and think the figure out actually did work how they said it worked
Martin Oliver at GDS and GDS for giving me the time to research the project we're currently writing a tool that's going to collate all this kind of agent driven data into common serve and represent it all conveniently within burps as an extension there are various problems to kind of get over before this goes live is remotely usable but we are in that process at the moment and last of all thanks to be size 2014 for giving me a chance to yeah you thank you
Related talks
 28:37
28:37 47:15
47:15 33:48
33:48 49:41
49:41 34:45
34:45 10:48
10:48