Measuring the IQ of Your Threat Intelligence Feeds
Show original YouTube description
Show transcript [en]
all right we're going to go ahead and get started ladies and gentlemen boys and girls be slides Las Vegas is proud to bring to you two of the finest minds in all of information security over here we have the man whose beard has no fear one of the most influential voices in information security one of the former authors of the Dvir I know you all know what that is mr. Kyle Maxwell and over here we have the Brazilian bad boy of science guy in the ml SEC project and a darn handsome fellow ladies and gentlemen Alex pencil and Kyle Maxwell and this is why I love when Kevin introduces me he's too much of a
wrestling fan to go very quickly through who we are I'm a researcher at Verisign eye defense I'm a malware researcher there I'm a math smuggler when math labs get blown up didn't you know why that's me I used to be the student responder I fortunately don't have to do that anymore and that's very good for my ability to sleep through a complete night without getting woken up Alex will talk more about our hacker spirit animals but you may also refer to me as axiomatic armadillo if you blame a breach on me yes and I'm Alex and I do some science at anal sac project mostly training machine learning models that's not quite like Pokemon training I wish
it was more like it but it's not and yeah anyway with mostly of my research what and also a lot of what we're going to talk about today is about network security and I mean I was tortured by Sims as a child I don't want that to happen again and I really think that we can help so I'm caffeinated capybara okay so if you ever get reached by a Brazilian actor just maybe it's not me anyway we're gonna go over some things and I just want to make sure that you guys have a general idea and we're gonna let it we're gonna get it go get turn over to my good friend Kyle here for threaten tell all right so
who's still drunk from last night first only one hand I don't believe you you're all liars so what we're gonna do is go very quickly through an idea of not threatened till 101 because that's boring and here's we were gonna call it 201 listen I know it's too basic for that so we're going to talk about some basic concepts and actually I'm kind of kind of kind of deflate the rest of the talk and take a little bit of air out of his tires here because I'm talking about why a lot of these things suck in the first place so when we talk about threat Intel what we really care about our two core things about what somebody whether
it's an adversary or an ally after we're gonna stop using the word adversary gonna say our foes like the Viking warriors of old they didn't have adversaries they had foes what are your foes able to do that is what is their capability and what are they intending to do frequently we are measuring or trying to somehow understand the former oh look this exploit came out right there go might talk a little bit ago and so they have this capability but when we're talking about specific foes and their battle plans against your fortress we care also about what they are intending to do right because we can do a lot of things if somebody asks you or me to build
something yeah I can build a lot of things what am I actually gonna bill what am I actually gonna do what am I actually going to attack that's a different thing so this is the core idea of really what threat Intel should be all about its capability and intent both of those now that leads us to a couple of dichotomies if you will in some different concepts so we're gonna have a bit of a cage match between some different concepts that we have here first of all Dave I tell who I don't think is here but that that's good because he could totally kick my ass occasionally makes the excellent point that a lot of times we're using
indicators as a new term for we used to call signatures and that's not really true but it's kind of true it's true that sometimes we're using them that way but it's not true because we shouldn't be so a signature is should be kind of thought of as a print you know that if you see this particular signature it should be used in a way that you know that this particular thing happened either this particular event occurred or you can tie this to a particular foe or you can tie this to something in that you can be very confident about where as it indicators as Hey look over there something sneaky I heard a branch break
or something like that so the ID right right somebody's creeping up on you like Alex creeps creeps up whenever he thinks that my Scott should be his so these are when we talked today we're talking about indicators ie you would never announce and talk about why you would never just feed these lists of addresses for example directly into your firewall and say block all this traffic because oh my god you will get fired we don't have nearly that much confidence in these sorts of things this leads us to this idea of there between data and intelligence so when a threat Intel vendor including the one that I work for though the ones that I work for
if they say we're selling you threat Intel and they give you a list of IP addresses you can pretty much kick that sales person's ass because they're talking about specific data and data without context is useless if you don't know what this is for then it's pointless you want actual intelligence that if we talked about a moment ago says something about capability and intent and is specific if it is these addresses are bad real bad watch out then it's useless to you one of the other things that we distinctions that we make in Intel is between tactical and strategic and I could go on about this for literally a whole talk but I'm going to overly simplified what I won't
I won't because we've got cooler stuff to get to the idea is that tactical versus strategic are the really specific things so tactical Intel is the the what is happening and how it's happening and the strategic is the who is doing it and why are they doing it it's a little bit about capability intent but it's a structure a little bit differently because what we're talking about is for example strategic Intel might say that caffeinated capybara is coming for your secret coffee bean roasting plans right because he's gonna be he wants to use that to still eat your plants and smuggle coffee in from Brazil here because he secretly makes all his money as a coffee smuggler right right
whereas tactical Intel might say okay this is how he does it he's going to send this tight is gonna send a PDF with this type of exploit to these sorts of people and then drop this sort of thing this suddenly gets a lot more more tactical and down into the how and the what the other thing that's important just like with coding and with a lot of other things you have a distinction between atomic indicators and composite indicators so an atomic indicator is one piece of information an IP address a string that you're going to see in a packet where as composite indicators are going to be when you put these things together when you see this IP address or
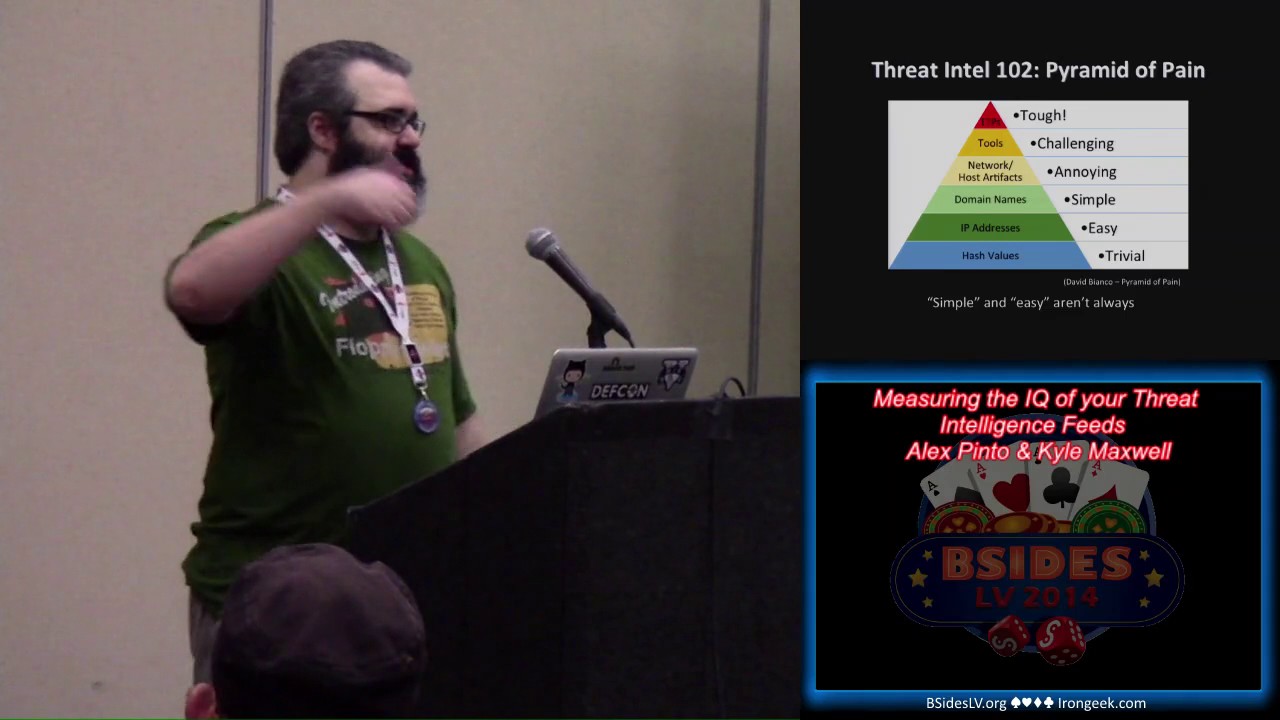
in any of these IP addresses doing these sorts of things and you cordon with other things now you start to go to put it they're going to get something useful especially as you ascend what we like to refer to as BP remove a I use this slide every time because I just like being able to say for a minute pain right so this is actually from a guy named David Bianco who works at I guess now fire I previously at mandiant and a lot of us might quibble with some really specific details Alex and I are in this but here's the basic concept that you should take away from this and the concept is really good
at the bottom of the pyramid of pain you get stuff that is really easy to find and really easy for your foe to change right it's really easy to get lots of hash values of badness and it's also really easy for the adversary to recompile with one bit flip and get an entirely different hash so that's not causing that much pain to your foe and it's not although even though it's not that painful for you to get as you ascend this pyramid it's more painful for you to get this information it takes more work more effort but also it's things that are harder for the adversary to change it's much harder for the adversary at the peak right to change
the whole way he goes about his attack than it is for him to flip this bit and recompile his malware versus it's also a lot harder to be able to isolate this information and pull that out pull that out and say okay this is how this particular foe works we talked about the fact though that when we say simple and easy as we're going to see here domain names and IP addresses are relatively simple and easy they're simple and easy to get that doesn't actually mean it's always simple and easy and we're gonna have a tool later on talking about why that is but with that said when you get these sort Intel feeds in general
remember there's really threat data with a little bit of context so it's kind of Intel but honestly it's kind of sucky because what you really want to know are who is going to attack you why are they going to attack you and how are they gonna go about doing it and I Peterson domain names we see here are just kind of the start of it so please don't think of what we're presenting today as anything like the be-all end-all of this it's trying to bring a little bit of structure to analyzing this value and then as time goes on one of the core purposes of Alex's AML sac project is to start to bring more value to higher
pieces of the chain as well with alex is now going to talk about whatever the hell so anyway taken from that I guess the point that I'm trying to make and this is kind of a math talk I guess is we don't always get our intelligence all packed all packed up with cute animal names right we usually are just getting like a bunch of IP addresses a bunch of domain names so can we actually measure this can we actually have a way to see if this thing's that we're just scraping from the internet or that people are selling us for a very very very high price by the way it's something that's actually helping what
we're doing right and of course intelligence is used very broadly here in the sense that as Kyle said it depends on the context so the data is actually only going to be as good as the use that you have of it and how applicable it is for your own environment so anyway count already mentioned some of the two things here that should we use them for blocking or not but the good rule of thumb is no maybe hash file maybe file hashes maybe host names right isn't the whole point of ii-era trying to open source antivirus signatures and I just got kicked out by a bunch of groups right now and but anyway we have a way now to to
gather this data and somehow apply them involved which is very good but we just have to be very careful with maybe host names I mean there's not a lot of reuse for I don't know evil hacker comm as far as SEO is concerned people are not going to be used at domains but there's a similar there's a there's a different problem for IP addresses again and this is a point where me and Kyle we argue a little bit our IP address is more valuable or less valuable than domain names right I personally think that the cost associated with changing an IP address for an attacker is higher than our main name it's easier for you to
publish now to register there know a thousand domains from your DGA right and just register in different registers and keep moving around but then you have this couple of IP addresses of places that either are turning a blind eye or they are somehow complicit with the fact that you are hosting Mau or something like that over that the fact that it's finite right the fact that there are different actors that are controlling those different IP spaces and some of them will be more lenient will be less lenient right that it kind of creates a structure kind of creates an economic incentive for us to to try to figure out okay let's try to analyze the IP addresses at least to see if we
can gather something from it it's something that's that's potentially useful right so the point is and the question is right can we try to measure how much they help right what are the kinds of metrics that we can get and given that we have a bunch of fees right how do we choose which one of them will be more appropriate for our use case or for whatever we are we're trying to build or protect against or something like that so anyway what what are we working for what are we working with here so we're basically getting raw information so this comes from a bunch of public publicly available feeds right we actually gathered this data for a
month actually I've been getting me for much longer but I'm only publishing a month of this data and we have some raw data right and combined is the tool we're going to talk later which is the one we're using to harvest this and we're extracting both the IP addresses and domain names as a first step right and then we are separating it out in inbound and outbound right because and this is just kind of the beginning of the idea where we are making sure that we have this bunch of indicators right and some of them will be more turned to ok these are people who are scanning you there's some sort of auto SS age exploitation or trying a
different IP address sorry different use names or we have maybe people who are spammy sending spam and we have the outbound view which is pretty much who are the IP addresses who are hosting malware distribution centers or the IP addresses who are hosting command and control service so when Alex first told me about this in pampers I found it finally way it clicked with me was its inbound or outbound from your network where would you expect to see traffic related to this address at the traffic inbound to your network for this for this fo or is it outbound from your network to maybe do a c2 server or whatever and yes that's precisely it and the data flow is
important we could we could if we had enough data if we had enough samples we could further separate this even more we could try to just have someone specifically for C and C have something specific for droppers or something specific that we're trying to be broad just to try to have enough data to to play around but anyway that's pretty much it that's 22 different feeds right some of them have data on both so you can see them separated there it involves an example and what did we do how did we prepare this data right and so first of all we're only interested in trying in in doing some experiments with the IP addresses so we we actually used a
passive DNS database from far sides to basically resolve all these domain names to IP addresses that were active on that day that's very important right most of these guys don't exist anymore but at that day these were the IP addresses that were were there for them and potentially were involved in something malicious because they were in a domain that was reported as malicious so of course if if if but that's the kind of assumptions that we're working with when we actually accept this trade intelligence feeds and try to work with them right and we also removed all known public IP address because they don't really fit the purpose of our experiment we understand it's a parking technique
we understand us or their parking techniques we know you're all pros it's just that it doesn't really fit this this this example anyway finally and I'll just get a little before you get to the cool stuff later it's just that it's kind of an experiment you can have to explain this check for each IP address we enriched it right we enriched with the information from the das right both das name and das number the country it's from right just because we want to play around with some animal names and the reverse rows host so what would be the the most popular PTR that it would have on DNS on that specific day again using passive DNS whatever yeah yeah so anyway
we're not playing around with reverse hosting on this talk I had some ideas for it but the data was too sparse it wasn't really worth it but we'll be mostly talking about a essence and we'll be talking about geo locations however although we're talking about geo locations we are not doing maps guys let the maps go they are not a good way to represent this data okay please write a bar chart to just say how they are let it go so this is this is what it looks like in the end right we have a small enriched sample here right and I just picked up three guys and you have an entity which is pretty much the IP address there are
already addresses which what we're using direction which source it came from they blah blah blah you can see it's all there and this is pretty much the the data set that we were using for this as you can see this kind of looks like code right then the wheel we'll get to that but this is all this is all actual commands from the tool that we are we're releasing and you can do you can just do everything and so on why would you do that but you can just redo everything at home anyway so what are we doing here we I came up with three different tests which have terrible names I take suggestions for new names and I think
this is an accident anyway we so we have what we are calling a novelty test right which is pretty much let's check as this feeds progressed during the day how much how often do they change I did not plan for this I honestly say that this is not a part of the talk this is not this is not a drill anyway how often do they update themselves is it like the same list of IP addresses every single day our new IP address is added our IP addresses leave the the the actual list how do you how do we compare that a very interesting one which we are calling overlap it's pretty much you've got all these
different sources are they just giving me the same IP addresses or the same domain names right and I actually buying two things for $50,000 I have my best people on it and okay I have Kai on it I have 50 so 50 K and one feed and 50 K in another feed and are they just gave me the same IP addresses and I have no idea what I'm doing and finally the one that's probably going to be the most interesting one at least was the one I get most thought was the population so and that's really where we use the ASN and country thank you so much and we could take the country shut up Kevin and
we take the country the SN it into the comparison so population is a very important metric here and I'll be mainly using the entire world as my population so and I'll explain what I mean by that and ideally when you're comparing with population distributions you should be comparing which is your world so think about your organization and all the IP addresses that go in and out of your environment on your fire or something like that and that should be your population in your world it's it's gonna be very different from whatever distribution is is there okay so we had three tests we're gonna talk about these three tests and there's gonna be there's actually not gonna be some example code
but there's there's some example code available where you can you can try to run this test on your stuff right but I'm not putting together a matter there's not gonna be a number right and especially because I want to keep the friends that I have that have provided me with data but I guess that the point here is that like all things in life there's no real right answer and I just want to make sure and this is a very strong point in the talks that I try to make and I'm not very fond of information asymmetry so if someone is telling you it's trying to sell you something you should be able to evaluate for yourself if that is
actually going to be useful for you and not just blindly trust them because whatever marketing strategy they are using at the time so make sure that whatever you're buying and I'm pretty sure they're all awesome and there's a lot of awesome stuff that's publicly available as well you can freely on your own lab compare the stuff that you can get online with the stuff that you're paying for you might find out that 90% of it is just repeating the stuff you can get online for free so is it really worth the money that's a question that I'm not going to ask it's a question that you yourselves will ask while you're playing with this kind of thing
anyway so in that point we start with novel to test and this is again I'm gonna be showing examples of novelty novelty tests being run and you can pretty much create create a bunch of these graphs and everything and I know the graphs suck I wanted to do ggplot2 but I'm like there was not enough time there will be an update for that but one thing that I always tell people is get a trial always get a trial and try to measure what I'm calling the addition and churn so pretty much each day right so when you see the the blue curve so of course the zero is the zero you can see that the the the black curve there but
the blue curve is for each day what's the percentage of the data on that day that was new right so you can see the alien volt alien vote is by far the largest data set that I have this is for inbound right they have a bazillion scanning IP addresses that they probably have a bun of honey pots and stuff and so on average there it's like 5% of the AP addresses each day is new and about maybe 4 or 5% is dropped from the list right so if you if you compare them so these are the 5% new and this is the 5% that were on the previous day that left so you can see that sometimes you have
stuff like to pursue 20% sometimes you have a little bit less and this shield is is interesting interestingly consistent for the amount of the of the of the size that they have they're only they only publish the top 100 IP addresses on their on their public feet and it's it's very consistent it's it's not changing more than 50 percent which is interesting it it kind of gives you the idea that whatever pool they're drawing from right it's it's actually fairly consistent the guys who were attacking those honey pots I don't know if that's a coy technique I mean there's a lot of difference that we don't know on how these things are being produced but at least you can you can get a
general idea so the last guy there is the kind of guy that you want to be a little bit weary of because there's no churn right I mean I piece don't leave the the feed that's a whole month so I mean I'm pretty sure some of these guys were cleaned up right and the actual new IP is being added or like okay that's a very small number there and so just be careful it is this is this appropriate for your environment or not you just have to be to be conscious of that this is a different view and this is a view from outbound and it brings up another point that you can analyze when you're
talking about the novelty test so is this something that updates daily or like hourly some guys like every hour they have new stuff coming out or is this something that it's weekly or periodical or people update when they have the time or something like that the thing about there's no interesting good or bad here and usually the people who do the more weekly kind of stuff especially on the on the open side of things they are actually carefully curve raining the stuff that goes in so you have to be to be careful not to to to use too much judgment like oh this is not updating fast enough but some people are very careful with the data they put
in and that's very very good and also the novelty test helps you see some patterns right pretty much how how our domain lists and more domains had this huge spike that's about 29th of the 29th of June 30th of June so for those of you who remember this was when no IP had the thing with Microsoft right and so everyone started publishing a bunch of domain names that they got so you can you can kind of see those friends and try to understand so if everybody moves and whomever you're relying on doesn't move you might have a lagging indicator there might be some information there if they're doing their job well or not but anyway just be careful not to get an
abandoned feed that happens right justjust there's there's way too many just make sure you're getting the ones that are good so moving on right there's an overlap test and the overlap test is one that it's it's much better to look at and looking for the similar patterns than the other one and we want to make sure you are getting different data right and as an example here on the on the inbound we can see that a lot of those feeds right they are kind of sharing data among themselves I'm not seeing they're copying each other that that would be preposterous but they are probably sharing honey pots or or something like that and there's a lot there's a lot of
information that circulates that we do not see so sometimes it might be depending on the kind of infrastructure that you have to actually get gather this information consolidated it might be aware for you to draw up some feeds because they're not really adding a bunch of stuff that you need and but actually but just stick with less that cover the the best that you have so just just to make sure that you guys get it the diagonal here is when the feed meets itself right so it's I always want it always overlaps with itself and then the brighter the color it means there's more there's more ratio of overlap and this is a sample with
inbound data on this is the 1515 of July and a similar example with outbound data is interesting it's very diverse at least from the from the from the feeds that I specifically chose and if you guys if you guys can't read it and that's alright there's of course you can get much much larger features on the on the repo but it's interesting how the zoo's there this is the up you CH news it's it's being happy there's a high correlation with the information from alien vote as well so alien vote is already carrying a lot of stuff from zoos when they use there are confi on that specific day that we saw the spike together with domain lists and more
domain listen tomorrow domains you see there's a that's a 25% shade there that they were sharing they had similar the similar indications together anyway moving on we talk about the population test we really want to try to make sure that we do the enrichment and we can somehow measure the information that this enrichment brings us because I mean are things more likely to be come from a specific country or a specific other country right are some countries inherently evil and now to get them right our human being is predictable I mean there's these are all big big questions but I guess the point is my point is you shouldn't take anyone's word for that because different people
may be targeting you for different reasons and let's let's have a look at some some of the of the stuff that we got here so this is small I'm not sure if you guys can see it but on the top there we have inbound data for a specific date this this is are all the feeds combined right I'm not I'm not separating them out anymore and outbound in the middle and on in the end we have calling the true population what I call the true population as this I'm using the max mine ggod b UI PDB as the a way to enrich these guys so if I just take that the actual database and just count
how many IP addresses I have for each for each specific country that's my true population that might be the actual true population because that there's no guarantee that that is 100% correct but as far as we are concerned on the test that we're doing this is the true population so we can try to test against it and it's interesting of course from an inbound perspective China all the way China is like almost 20 almost 30 percent of the traffic is coming from China and followed closely by the US but when you talk about the outbound it's curious because the actually if you have to squint a little bit but they're very close right the US the amount of stuff
you have coming as hosted in the US it's not as much as this stuff that should be it's hosted in in China and it's actually a quite at least visually right it's a similar proportion and there might be something wrong with the data and we will explore this this later as well but it's interesting to try to use this as an exploration techniques to the stuff that you that you actually have when you look at a SNS of course we have a bazillion more a SNS and but it's curious that Google seems to be winning on the on the public outbound and of course that there's a lot of parking techniques that part stuff in Google and
we're actually going to analyze that a little bit more later but China doesn't doesn't figure out quite as permanently there as well when you think about it and many way inbound is crazy and bounded so it's all sort of stuff but I guess the point here is can we get a better look right because I hate swinging at graphs as well and that they're not being really helpful so what we're trying to do this he is actually do some inference based Council and let's let's do some hypothesis testing that actually the populations that we have in a specific data set and my true population for instance they are the same and let's see if the data agrees
with the fact that this is the same population it will it will tell me I mean the the statistical technique will tell me if it is the same if it's not the same and what is the approximate difference right we're actually putting together two different types of tests one of them is an exact binomial test when I have the true population which is like I said the max mind a B or something like that I can just say okay this is the true ratio and I just want to see how much of my data approximates that raychel right and when I actually don't have the true population I'm trying to compare for instance what my
data looks like to what the data of the of the actual tread field looks like or comparing two different thread things I have to use a different test it's it's a type of chi-square test that I'm using I will not explain the statistics here you're more than welcome to look at Wikipedia because I will not be able to give a good explanation you guys would pick it up in me I have no idea what's going on behind actually just a little bit but that doesn't matter that doesn't matter they work they work anyway why do here there's confidence intervals we have a degree of measure we have details and p-values and I apologize for Alex
Hutton but I didn't do my my Bayesian homework very well so I'm stuck with p-values for now and but we're trying to be very conservative on the use of these guys so anyway let's let me show you guys what what an output like this looks like so the idea is that we have a confidence interval that is the output of that's the difference of proportions right so we get the data from a specific date and we're comparing it against the true population and when we see and this is a top-10 I'm getting the top 10 countries that I have I'm not testing everyone because if the numbers get too small it starts getting very it messes
up it's not able to give me good answer and what we get is that there's some are much higher than they should leave like Thailand and the US and there's like Hong Kong there there's Russia of course but some of them are less than they should be so China for instance it's less than they should be so if you if you take into consider if you if you go with the with the idea that there is a correlation between the [Music] its random the way that these things present themselves right there's less i militias IPS from china then there should be by the number of IP addresses that are there and and there's some guys
who just don't care like germany there it's like me i don't know i'm just just chillin just just the same so it's an interesting view because then you can start making the decisions for yourself with your data about is there a country really out to get me right and of course we do not endorse this because it makes no sense to make attribution by geolocation but it's you start to gather some different information it starts to in enrich and gather some insight and intelligence from the little that you have so I mean not all countries are covered by by by a hacker spirit animal name so we provide a guide here if you guys want to name your own actors for
some reason right just to clarify so capybara is like the south of Brazil and toucan is like more of the Amazon area so we actually there's a very different lineage going on but anyway it it's obviously just a joke but the point is you can start getting the data and trying to get the inference for yourself and try to see what works best for you or not and we like I said we can compare different populations right so how did the Train evolved from the 11th of July to the 12th of July right and then we see Thailand again is increasing we should get an animal for Thailand I had no good I had no good
ideas for animals with China the tiger is India it's already taking we need a new one we need a new one anyway but we can you animate we're doing this for four countries we can do this for a essence as well right and you see Google is a top meat there again it's the proportion of the data that I got when I ran this test was 10% more than it should have been so it's like let's see 20% it's of course that's not the actual number let's say that 20% of the ideas of the Internet are in Google I'm saying that 30% of the IPS that I have are malicious and that sounds wrong because
it kind of is and at first I thought this was only parking right yeah everyone's using 8 or 1 1 1 1 1 2 3 4 it's all it's all Google owned but I mean it's not parking and we clean up a little bit and we see up its you know there's like Chrome Google calm and the threat intelligence feed there's like Google API so calm that happens a lot and this kind of analysis if you're not going through line by line which no one is is the kind of stuff that can help you pinpoint and clean this stuff up on a very rudimentary term a lot these are the concepts that are used in ml sect
Rajas for some of the data cleanup that we use for for the training of our machine run models but anyway let's get to the good stuff this is all released now it's GPL you can play around with it you can point at it and laugh on what a bad bad code it is and but the idea is that I'm sharing the code that generated all this graphs and did all these analysis there's some documentation and yeah and I'm really I really wanted to see some suggestions if you have new ideas for tests I really want this to be a work in progress I have other talks about this subject this is pretty much what it was able to
come with with the looming deadline and anyway and it's an hour don't beat me up for this this is not invite but anyway this is the chance to learn a statistical language guys get with the times we're all doing big data now so anyway but another important question is how do we get the data end right and did I invite back my good friend Kyle so the other thing that we did that I spent a lot of time working on is combine not combine but think of like a like a harvester so bringing in all these feeds take some work you may want to be able to bring them in not just for your analyses like this but for different
things there are number of ways to do that so we wrote a tool called combine that's also GPL dand available to you now we open sourced it this morning just we really like right and and you'll see the names of all the different components kind of follow this you've got the Reaper that pulls the the feed directly in thresher just kind of sorts it out into a data model winnower will do the validator plot all the reserved addresses it'll do the enrichment for you and then Baylor is going to shove it out in some form that you can consume elsewhere the sigh box piece is not working yet but CSV and JSON are there now if anybody wants to send us a pull
request we're happy for those but we're trying to continually feed more stuff into it as we're doing this you can feed it more any of the feeds that are listed there by default that doesn't mean we think that they're good or that they're bad it's just that those are the ones that we have um and then finally when we're doing this enrichment come on I'm from I'm from Dallas so Hank Hill is a necessity think about the metadata that goes with that we talk about the context so reading into a s ends bringing in a little bit of geolocation if you we have an open issue to do dns resolution with other sources but for now it's the Farsight DB and
then again you can just go to M L SEC project or go to our github organization there and get get all of this as noted earlier I'm a GPL zealot information wants to be free so we released all of this code in that forms that you can use it for for your purposes as well I guess a point here is that this is something that I looted before these are actually components of what we use internally on ml side projects so the idea was to clean up the code and try to release it and actually replace the internal versions that we use by this version that hopefully one of you guys will be mildly interested and will like file an
issue this and then that's pretty much what we're trying to do this is the idea is to keep this this going and as I learned more stuff as we learn more stuff we try to give you new potential windows in the data that you might have to actually help your decision-making so if anyone want to talk more about the male side project I'll be available around whole week right and we can test your if you have private feeds we we had the original idea of doing private feeds on this talk but we didn't want to get too much in trouble but if you're interested about how your feet performs or something like that we're more than
happy to chat around anyway that's almost it guess the main takeaway is you have data analyze it please write and don't just go buying stuff and there are ways to measure what we're doing there are ways to to to try to see if it's a good fit for you right and and it's probably the best way to go forward before I mean you should I mean who really buys the first car they see right that's that's pretty much the point and anyway if you'll guys if your data is like being left around and not proper exercise just hand it over to us we'll take good care of it lots of exercise lots of fun playdates and stuff like
that yeah and anyway what you got my friend let's talk let's talk let's talk and anyway that's pretty much it thank you very much we have time for Q&A anybody questions that is a good idea that that is something that would easily be could be implemented right so how what is the the median or average age of a thing there I think that makes perfect sense and this is definitely something that I should be working on yeah but it's not the same and sometimes stuff weird stuff happens like the the thing disappears and then comes back this appears intense then comes back it becomes a little bit harder to to to measure but aging is an excellent
suggestion is that okay yeah so I'm curious on if you have thread feeds or classified by vertical industry and is that where the taking your own population is where that would count yes that that's exactly what I mean the thing is I mean I although I do have access to some of those feeds more vertical base and they're they're they're semi-private their internal sharing and it was not my intention to publish any data for them on this talk and related to that is what we talked about about the beginning about the types of data that you want IP address feeds a lot of times are not specific about targeted to certain verticals or whatnot other types of thread Intel will
be and that's where it gets more useful as you ascend the pyramid of a but what we're trying to do is let's create a set of tools that then you can get your data that you can share with anyone else it's your industries or something like that and then you can start comparing how different and good is a very strong word but how different or what kind of stuff it has in relation to the just things you can find out later that's that's precisely the intent so do you care about you said you care about specific data from specifically SSH targeted attacks as I started a project called SSH ranking a while ago it's horribly were and then placed a lot
but the logging goes through basically what I'm doing I'm collecting who's trying to hit my server and basically ranking who's the best at doing it with this group course of house would you be interested in that type of data yes the point yeah the point is and the generalization that I made is that I could have like okay this is specifically inbound as a sage data right and we can try to create a picture of what does this inbound SSH data thread looks like right but I don't have enough samples from enough people that specific kind so stuff like anything like this would potentially help creating this population and then generating not so cool graphs like these
ones for going forward anyone else gable wanted to say some but he is not like proactive is the microphone so have you tested any of the commercial feeds out there I mean obviously you didn't put some of this up here but what can you tell us
what I would say is here's what I would say here's what I would say if if I were to hypothetically run those tests against commercial feeds right I would be very surprised not to find a significant overlap of stuff that you can find on the internet I'm sorry sorry for the commercial feeds you'll find very little overlap between them they team they tend to be incredibly targeted in through what they are selling for some of them yeah you're probably getting better stuff than I and that's very likely but again it's all about what's the threat and we're trying to be very broad in this in the scope of what are the different analysis like but yeah
if you're like oh there's this a specific group that we have been tracking for five years that's hard work right and I really respect this kind of work and these guys will have the best data anywhere about this specific group it's just that sometimes it's I just want to make sure like I mean that people are able to measure this because I've seen tracking tracking this intrusion and those data will have very little overlap you also a lot of commercial feeds that are these overlap almost completely with all of the public that you refer me which is why you want to get a trial if you're if you're gonna pay for this stuff the same way you
would negotiate a 30-day trial for a new monthly can light spots what you're going to get you want to get a trial of the data and then run these tools against it and say what the hell guys or hey this is a good data it's only you can only resell an input if you want a number by the license yes there's one here and there's one here yeah
okay so the indicators you had provide a lot of information about which fees were providing unique data regularly however they didn't provide any information about how whether those IPS were potentially false positives how would you tell if your intelligence feed is just feeding you every IP they can find on the assumption that that increases the number of malicious Ivy's in that theme if I knew that answer I'd be rich right now yeah now the di I mean this is a very hard question of course and the way that I do this involves a lot of statistical machine learning trickery but but it's like in a way it draws a level of confidence on is this is this
the only guy that's reporting this specific IP address overall the population of guys that I've heard talk about this kind of stuff right and the the actual the actual idea with this project this specific sub project is to try to create better tools for for you to be able to do this semi-automatically right I mean I'm never I mean I was speaking on Chrome there chrome google.com maybe it was a watering hole some day I think I think not right because the Google people generally know what they're doing but we usually get stuff like that from watering roll holes and yeah there's a place for a feed with watering holes but that should we be
mixed up with the feed of the stuff that you really know is is yeah so there is there's always also always a problem of classification of what you're getting and people just mix a bunch of stuff up and sometimes you don't know so I mean I had I specifically had a hard time with with some feeds that they just decided that it's not just malicious stuff it's also add stuff so any ad networks also go into feed and I'm like man that's the whole internet let's just what everyone so it again you have to be able to try to tell what if what you're getting is this good for you I have one there yeah okay that
lets pretty boy talk so in case did you look at any of the data and compare it to something like known IP ranges of major major cloud providers to see if sort of any of these threat feeds skew toward cloud providers in any way this is like the second one yeah yeah so I haven't done specifically that right but man if you can get on a P address for cheap that's a great place to drop your malware but it doesn't stay the problem is the volume is too large it doesn't usually stay there there that long right because again the Amazon guys generally know what they're doing and they think it certainly fix stuff up like that I I
guess I'm kind of curious though like if there was any indication that maybe some of these people actually place their honey pots inside of cloud providers and that you might they might skew toward more IP use from cloud providers showing up in their list because they might scan sort of locally right it's cheap to scan inside of AWS no I didn't I didn't specifically it might be very off top but that's an interesting thing yes yes sinkholes is a very interesting subject that I went to to look in yeah hey I just had a quick on for you so in several hundreds of thousands of IPS were blacklisting right now I did a quick and dirty open DL comparison to my
hundred thousand initial build list look for actors and thinking there'd be some correlation between open VL it's full list so 39,000 compared to 100,000 I want to take a guess of how many overlaps five percent 28 just 28 28 just 28 I sees over 39,000 on our list is now growing host million over the weekend we had a million accounts created by these guys the capability from my perspective of this bad ID range is global literally I'm saying I've used in countries that I'd know I have ranges I think there are capabilities is coming out and I'm rather shocked at the enormity problem and then how little I found an open DL just as a simple comparison I think it
justifies that some black lists will be targeted to certain ages yes definitely and man this thing there's a and there's a I haven't really explored this but there's a huge XQ on our country right if your honey pots are in the US or your if your honey pots are in Europe it's ridiculously different the kind of the kind of action that you see and yeah that's that's awesome we should give you I guess that's it I'm sorry sorry for you'll never get this hour back I'm sorry
[Music]
Related talks
 54:05
54:05 27:37
27:37 16:22
16:22 8:26:49
 40:18
40:18 22:22
22:22