Exploit Prediction Scoring System (EPSS) - The User Guide - Chris Madden

Show transcript [en]
hey folks good afternoon we're going to talk about the exploit prediction scoring system epss the user guide show our hands how many people know what epss is or have heard of it oh wow I would say about 80% of the audience J Jacobs will be happy the the guy who created it so my name is Chris Martin from yo product security team and I've been working with epss on epss and using epss for approximately two years now so risk is for asset and depends on the impact of a vulnerability being exploited by a threat so most people would have read that thought themselves yeah makes sense I get it so I read it and I thought well I
don't get it how do I use all that so this time last year I presented a b sides top left understanding vulnerability data trying to understand all the building blocks whether it was epss s Kev all these things and how can I use them to optimize the flow of software in our devops pipelines so since then um I've gone on to work on a guide in the middle risk based prioritization guide and that's what I'm going to talk about in this talk here bottom left epss this morning I spoke about impact and uh top right recently gave a presentation at carne melon sech on vulnerability prioritization options and really all of this comes from risk is
paracet and Depends of the impact of a vulnerability being exploited by a Tre those few words going deep on that so why the content so recently few weeks ago you know somebody posted on LinkedIn they were trying to come up with a taxonomy and somebody working in automotive and they came across my bsid talk last year don't know this person but they found the content useful and that's pretty much why I do it to help me and others like me um understand this stuff and apply this stuff and benefit from this stuff so the abstract exploit prediction scoring system the user guide so epss powerful capability to help organizations prioritize vulnerabilities based on their likelihood of
exploitation and it's an important cap ability and we'll see why shortly so it's free publicly available and there's growing support for it in Vendor tools but what I found was most vendors and users don't know how to use it so they ask for it they get it but they don't know what to do with it and I'm on The Advisory board for some vendors and I asked them hey why don't you provide any guidance on you know your tool supported why don't you provide guidance and simply but they don't know how to use it so that's where I stepped in so originally as a user I want to understand well how do I use this thing
um so I volunteered to work with the with Jay and the epss creators to write the guide from uses point of view and the guide was released in March um at that URL and socialized via LinkedIn so in this talk you learn to understand where epss fits in the overall R picture how to use it and why and how others are using it so the guide launch went something like that
at the bottom are the various folks that contributed across the globe across Industries some of the T leaders in this space and so my value ad was to work with those folks some of whom created various standards or worked on standards and organized the contribution um of their contents in a user friendly way so that normal users can use it so some of the feedback uh I particularly like the top left one very pragmatic um off to update or process Doo it'll be much shorter read do this I like that uh other feedback from people in telecom's industry and then um one that I'm particularly proud of Chris use anyone know Chris use heard Chris
[Music] use he's like the Mr Beast of vulnerability management let me put it like that all right so how did that happen I hear you asked well I'm glad you asked so let's go back to the beginning so in the beginning I said to Jay who created epss okay here's how I think we should go about this so add me to the slack Channel and the mailing list and here's how I think we're going to do things and for folks starting off in their career I think this is useful guidance this is something I wish I knew when I started and it's all about how do you get things done and deliver value okay so starting
off with taking a big thing you know Define the list of things you want to do the backlog of items prioritize the backlog based on the value they deliver and the effort requires to deliver them and get real customers involved whether it's vendors or users get them involved so basically turn those affected into those involved in delivering the solution so you get that tight feedback loop and similarly with the folks writing the standard work directly with them so again that tight feedback loop to guide what you're doing and then we flesh out the top items and we work through those and deliver on those in a short increments and iterate on that and learn as we go
that's standard lean agile stuff and most people especially techies don't do it and so before anything is done I'm very much into time management and getting things done so one way to get things done is to plan a meeting to present the thing that you need to get done and what's a conference only a very large meeting in front of hundreds of people whether it's in an auditorium or YouTube online so it's a good way to focus the mind and get things done so here we are today so as a hardcore techie I didn't start off focusing on the technical aspects I did start off focusing on customer focus and introduced the idea of design thinking understanding the
problem first and then design a solution for the guide again something that most teches don't fully get or don't do and basically getting users the affected users to write the user scenarios so they're involved and they're contributing to the solution the writing style very much opinionated there's a lot of books out there that lack opinions um when I was earlier in my career my boss told me look I don't want to understand this stuff you're getting paid to tell me what to do give me three options tell me which is the best one and why and that's your job all right give me the opinions and the data behind it so that was the style it's very short
succinct and I refer to various books if you want to read the history in the [Music] background and it's very much user Centric view because it's not sponsored by anyone I can pretty much say what I want and I did I do have opinions I've been around a while as you can tell from my hair and so I express those opinions trying to make this useful for users who don't have time to read read the books or get the understanding of just tell me what I need to do and how do I use this thing so after reading the guide you should understand risk I that formula we spoke about earlier there's a lot to it but it's relatively easy to
understand understand how to prioritize cdes by risk and that's a big deal because there's 100 CDs published per day there's now approximately 230k published CVS vulnerabilities open source and third party software so there's a lot to prioritize and doing so gives you a sign significant reduction in your security effort and in Improvement in your security po posture by fixing and remediating the things that need to be fixed first by risk so with the guide I like to understand and play so I also provided source code so not only did I I provide succinct opinions the rationale behind them but the source code so that people can reprod use the data in their environment okay so the in intended
audience was product Engineers security managers cyber Defenders and Tool providers which is a subset of the personas that we defined uh that we got uses to Define uh for the guide so the vulnerability landscape so as you probably know if you work in this space it's not a magical uh mysterious serious Wonderland as portrayed in the picture the reality is somewhat different and overview standards we have cves as in um identifiers associated with vulnerabilities in open source third- party software they're enriched um more recently the national vulnerability database stall and now other CNAs are picking up the enrichment and they're using CVSs to score the data and so all that data feas into epss the
cbss data and other data and we look at the other data sources to determine what is the probability of exploitation of a published cve within the next 30 days that's what epss ultimately gives you and then there's cisab which is a list of known exploited vulnerabilities okay so vulnerability reality then is somewhat different why should I care about all this well given the explosion in the number of publish cves increasing year on Year many organizations are drowning in a sea of vulnerabilities not knowing what to remediate First many organizations Industries whether it's PCI fedramp use the CVSs base course even though the CVSs guide says don't use this to prioritize only that's what many tool vendors and
companies do so solution is prioritizing vulnerabil by exploitation as recommended by sisa and Gartner whether it's vulnerabilities being exploited in the wild Al sis Kev are those that are likely to be exploited all ppss and doing so significantly reduces costs and risk looking at a devops pipeline as an example this is from the cloud security Alliance generic diagram we see that there are multiple tools across the pipeline that detect cves at different stages and about typically 80% is offer in products is open source so that's a lot of cdes so
exploitation so the point of all this is that if we prioritize by exploitation we reduce our cost and risk so the expanded quote by by cisa they give figures of less than 4% of the total number of cves have been publicly exploited now cisa is a security agency okay and they're taking a pragmatic approach saying Roden saying fix everything which nobody can um they say fix the ones that are exploited and that's like four or 5% is the numbers similar Gartner who isn't the security agent he's a industry analyst takes the same view focus on the things that are being exploited in the wild again to improve your security posture and reduce your effort so how many of
these vulnerabilities are actually being exploited well depending on which report you read only about 5% are few so that's in contrast to cbss base scores so 15% CBS are red critical as in scored 9 plus 65% critical are high 7 plus and 96% are critical high or medium is in four plus when you think okay if we have to fix mediums and above you think okay well that's probably whatever I don't know 10 20 it turns out it's 96% of them pretty much all of them and so with exploit exploitation data there's an asymmetry in the data in other words the highest risk things there's less of them and we can exploit that asymmetry or ability to remediate
depends on the priority of the risk of the CPS the ones we want to remediate based on our security posture but also on our capacity so by focusing on the highest risk things with the smaller populations that's how we can achieve that reduction in risk and cost so how to prioritize well a large part of my bsid presentation last year was coming up with this taxonomy and trying to understand well what are the data sources for risk in general and and specifically TR in this case and so if we look at things like starting at the known evidence and if we look from the top down this would be the populations are smaller and the risk is higher so in
other words if something was exploited in your book now the incident response before that's likely to show up again in the future in your organization and then there's cev there's approximately 1.1k vulnerabilities listed in cisv and then you have weaponized uh vulnerabilities as in somebody has created a template um that can be scripted in Menlo or nuclei those are much higher uh likelihood of exploitation and then just proof of Concepts and on average about half of the publish cdes have proof of Concepts so the population size increases significantly as the risk decreases we can see where CVSs fits in in terms of the generic you know thing is called severity but really breaks down two things there's the impact
metrics confiden Integrity availability and then there's the exploitability or automatability in how easy is it to automate um a vulnerability exploit so exploitation well it would be great if we could just grab the list of non exploited vulnerabilities all of them and fix those the problem is it doesn't exist cev represents about 1.1k of public CD we saw from the figures that about 5k of publish cves of which there's 230k are actually exploited so there's a gap so let's say figures approximately 10K depending on how you measure non exploited so there a Gap there isn't a list anywhere that says fix these ones so this is where epss plays in We can look at CIS Kev and say hey these are
the ones that are listed on C that are all exploded but then there's the other ones that aren't and we can use epss there and see how we can use that so epss well what is it so it's a DAT drien effort uh for estimating the likelihood or probability that a software vulnerability will be exploited in the wild in the next 30 days okay so think about that for a moment somebody's giving you a score probability between 0 one for all public CDs saying here's the probability it's going to be exploited in the wild in the next 30 days so there's a lot of folks involved in this myself included some folks um I've talked to here are in the special
interest group it's a fantastic Forum uh but it's from the same folks first who also manage and publish the cbss standard it's free and it's a measure of the threat aspect of risk and this is a fairly recent capability um as in recent years we didn't have things like epss or CIS telling us which ones are being exploited in the wild or likely to be exploited in the wild so what does it provide well ultimately it provides a score probability and you can also get a percentile in which percentile is that score which is kind of like a second order version of that score and then there's coverage and efficiency and effort figure which we'll go into in
other words you're probably thinking well if I look at the score where do I draw the line and so we'll look at that there's an API and you can pull all the data or individual data or time series of data so the model itself it was there's different versions the latest version was launched March last year there's another version updated version due round about now and it's improving all the time you can see many many data sources everything from gry noise to Sis various you know zero Day projects so many many data sources including social media and the idea is that as there's more activity on you know these feeds the likelihood of exploitation increases
and the partners have a lot of data as in the intrusion detection systems that are used as an input signal are deployed across many many thousands of organizations worldwide and so it's based on the scans for cdes showing up in those ids's and honeypots so it's based on what's actually happening in reality across Enterprises and that data is used to for the model to predict and train on did it did the model match those data those exploitations or scans that were detected from the ids's ids's and so you can as with any model tested forward in time um to see is it actually working and it does and it's improving all the time so various
vendors are using it there hundreds I've listed some some of them you'll you'll know quite well so many tools and vendors are using epss from AWS Etc so epss applied okay so how do we apply this to our environment well the very first thing I did when I looked at epss is I like to validate things not you know take things in blind trust so if you're going to validate something that predicts exploitation I thought well where's the data source for exploitation so I looked at cisv so cisv is a list of non exploited vulnerabilities by cisa US government agency so these things are non exploited um and I plotted epss versus those uh CVS looking at say CVS
says base score and epss and then color coded them so if a cve had a med exploit or nuclei template in other words it was weaponized then it shows up as purple Etc so trying to provide the um color coding of the data sources per our risk taxonomy so what we see is for C C is about 50/50 so what does that tell us does that mean it's not working or it is working well it is working but not all the vulnerabilities in cisv um are prioritized by epss and we'll look at why that is um but recalling that cisv is only a subset of the known exploited vulnerability so ultimately we're going to use these two things together cisv
and epss so even if you look at the subset of cisv so cisv represents the 1.1k the most important cves of the 230k public CVS and within those there's cyber security ADV advisories published by sisa another international government agency saying of that 1K 1.1k subset here's the most important subset of that and if we plot that against epss we'll see that epss is high for the vast majority of them but not all of them again there's good reasons for that so how do we use these things together um known um or active exploitation with epss and this is it so putting together the Emoji worry qu quadrant so pretty much if something is known actively
exploited whether it shows up in your organization through your book Bounty or is listed on CIS or some other source that says this has been actively exploited then that takes precedence you know that's the priority regards what epss says then there's the other ones that don't show up in a know exploited data source but epss says is high so they're priority as well so you use them together so it's like an or of the two things so do they show up in example CF and is the epss score high that's how you use it and you know that amounts to approximately 5% of CVS that are being exploited that's how you determine well from no known list of here's the
actively exploited CVS which ones you want to fix that's how you get towards your 5% simple as that okay and it's important to call out that it's approximately 5% depending where you cut the threshold unlike cdss where you know as you said if it's critical that's 15% if it's critical high it's you know it's these are Big figures when we focus on exploitation we effectively exploit the asymmetry in the data and we're looking at approximately 5% of CVS that's the the beauty of focusing on exploitation it's a much much smaller subset with data sources to pack it up so epss for your environment so epss the model is trained on Enterprise environments so if you're
an Enterprise it'll work well okay if you're a car that's a different setup um so it's important to understand that you know if your environment is an Enterprise large or small epss is a good fit and that's purely because the intrusion detection systems that are deployed that are used as as data validation for the model they they live in Enterprises across the globe so not to say it won't work so well for car uh it will but there are will be some differences based on the difference in environment and it's also best suited to network attacks again based on the technology used to feed or validate the model these intrusion detection systems and honey pots which
are accessed over the
network so when we're writing the guide there was a um vulnerability that CA warned about and it turned out that the attack Vector was local as in not Network and that's why it ultimately had a low epss score so on the one hand you had sis saying oh this is bad you need to fix this epss score was low and that's again that's okay we said we can use the two things together CIS or high epss okay so zero days so epss relies on CVS CV e data zero Days by definition don't have CV is assigned to them yet so epss is not going to tell you about the zero days until you get a cve
assigned um Gartner does say that you know we tend to over focus on zero days even though a very small percentage are actually um zero
days so some of the takeaways from that section we shouldn't use CVSs or epss alone we should use them together um epss can be used with non exploitation as an or to prioritize yeah we're not going to get epss scores for zero days and we shouldn't go chasing zero days for CVSs it does support exploitation maturity as in that is data input but it's up to you to provide it unlike the other CVSs parameters that are provided you get to provide that okay epss thresholds so with all these things it's kind of where do we draw the line um within the epss special interest group when we writing the user guide I asked users to write their scenarios and what
they wanted so typically what people ask for is what they're familiar with so things like cbss it has these scores critical High Etc and so they want the same for epss so and that's you know they don't understand epss so they want it to be familiar and similar to what they're familiar with so CVSs as I said already supports exploitation maturity input which does affect the scores okay that's the temporal aspect of CVSs beyond the base score and so if you do want that critical medium high with CVSs then you just plug your epss data into that and that's how you get that uh rather than trying to assign critical medium highs directly to the epss
score second thing people often ask for is well just give me one source and that's especially for Tool vendors they don't want to have to pull data from multiple different sources whether it's cab or whatever they want to say okay you have a tool I want that to be the single source of truth but the reality is as we saw it isn't by definition the single source of Truth uh it should be used in conjunction with other uh evidence of explo like cisf and using the two things together is how to use them so by definition it isn't the single source for exploitation but again if you want to you know roll up or combine these things you can roll them
up into cdss the uh temporal score so now we're going to talk about thresholds and to understand thresholds we need to understand precision and recall and this gets into you know true and false positives and negatives and there's no Perfect Tool there's no magical tool that finds all the stuff you need to find and only that stuff you always get a it's it's it you know comes down to where do you draw the line the more stuff you want to find the more stuff you're going to find that you didn't want to find that's the simple version of it um Illustrated here from Wikipedia it's a it's a good view of precision versus recall so we can use this as a
way to determine thresholds now this is complicated but it's it's not once we understand it so let's start with a perfect tool its precision and recall would be one so would be up at the top top right so there's no false positives or negatives ultimately so we're up at the top right that's a perfect tool doesn't exist in reality but that's if it did that's where it would we'd have a nice you know Square uh lines in our diagram so the idea is we want to get as close to that as possible and you can see over the model versions Green version one version two we're now at version three it is getting a lot closer so it's getting
closer to that um perfect skill bottom left is if we say that about about 5% of CVS are actually exploited that means that just by guessing we're going to get whatever 5% of them right if we were to guess so that's kind of just no skill and that's you'll see that's pretty close to where CVSs is in terms of CVS is not a predictor of exploitation and it's not designed to be um and you'll see that's why the cdss score shows up down there so don't use cdss scores as a predictor of exploited and so then the idea is that looking at the model and looking at how many things showed up in the intrusion
detection system as you know um these were these vulnerabilities were attempted to be exploited based on the signatures detected we can draw cut the line at various thresholds for epss and when we you know plot the graph this is what we end up with so that's sort of good in terms of the model you know we can use standard things like the F1 score and it's kind of like an optimal version of true and false positives and negatives that's cool but as I said earlier ultimately we care about our effort so if we look at it from an effort point of view now this was the original diagram um not many people get log diagrams and so this is kind of a bit
overwhelming initially uh what this shows is coverage which is you know the percent of vulnerabilities with observed exploitation activity um that we had prioritized based on our threshold and then the effort is well how many what how many did we need to fix and so it's all about where do we draw the line This is for most people they don't think in log scale so it's it's harder to understand um we do care about our efforts so let's take the same data and just use a linear scale and so with emojis to support it so when we draw it from a linear point of view when we look at the epss probability for all published cves what we see is
that um there's very few cves that have a high epss probability most of them the vast majority have a low probability that's why the the graph you know is like that hockey stick okay and so what we want if we start off with step one we can look at the effort line at the bottom and we see that there's a relatively small change in our percentage effort for the eps's probably range from like 100% on the right all the way back to 10% okay very little efforts in we don't need to fix much more to address that between 10 10 to 100% of cdes by epss probability so that's interesting second point then is well
there's a large change in percentage effort you know um as we move down below that approximately 10% so we are sensitive to our effort that's our cost resources but we end up fixing a whole lot more of cves and they have a lower probability of exploitation so we kind of want to stay away from that area because we end up fixing a whole lot of stuff that is less important and so the efficiency drops off significantly From Below 10% so in simple terms we you can pick a initial threshold the guidance is simply given all of that pick a threshold of approximately 10% for epss and adjust it based on your reality how many CVS show
up in your organization and what your uh resources are and the other thing is for a given organization the graph when you plot the epss curve the probabilities for those cves is going to vary so if you have more cves with higher EPS scores the graph is going to be shifted upwards or downwards if it's the opposite so there's no point in picking an exact figure like 097 that doesn't make any sense unless you know what you're doing so that's why 01 is a good approximation the guide basically says look start start at 0.1 and adjust based on your CDs based on your reality and this is we um worked with edcan they provided data uh in terms of detected
cdes and this is a plot um of those so we tried to use real data to inform the guide okay so if we look at some of the the benefits of epss so in addition to allowing us to focus on the things that are being exploited at 5% the other thing most folks are interested in uh early warning I want to know you know in advance if something's going to be exploited and we can see here from a recent forunate report um that's exactly what epss gave us for this example here it's uh wo Commerce vulnerability but the same applies and it just shows okay the timeline the epss score um from 0 to 100% in blue and red is on the timeline
when exploitation was actually detected in the intrusion detection systems so you'll see that epss triggered went high before exploitation activity was actually detected for real so that's a key point so epss gave an early warning of exploitation before it was actually detected so epss can be used as an early warning okay so getting ahead of things that are likely to be exploited so interestingly what you see is the nuclei templates were added so when vulnerabilities are weaponized as in they show up in men nuclei the probability of exploit goes up significant versus just a proof of concept so this is a another very important capability you know for organizations to get ahead of those that
are things that are likely to be exploited okay risk-based prioritization so given we have exploitation evidence as in cev and epss we can plug those values into CVSs and when we do that if we look on the left we have the CVSs base score which doesn't use that input data and then if we plug those values in we get the CVSs temporal metrics which support the exploit code uh maturity as an input as we feed that data in and what we see is that relative to the standard CVSs Bas score some of the criticals drop to high some of the highs dropped to mediums and so we end up with less criticals and highs Etc not
significantly less but less all same so that's a good thing if we're using cbss and using exploitation data so that's all part of the CVSs standard and we can use as I said CIS or epss as inputs for that alternatively we can use decision trees Allah the folks that list the non exploited vulnerability sisa they also have an alternative prioritization scheme ssvc cbss backwards and what's good about that is it's extensible and it focuses on exploitation so the three parts of risk are exploitation we talked about the automatable or exploitability and the technical impact so by looking at the data sources we can determine for exploitation or is that active exploitation in other words is it actively exploited or is it
weaponized uh is it just a proof of concept or is there no no evidence of or PC's of exploitation and when we plug those parameters in so the two on the right are just taking the CVSs parameters not using the CVSs score but using the raw data as provided by cbss uh organizing the exploitation Noe on this data and here's what we get so we have a decision tree and decision tree is very simple visually to understand there three those three parameters are shown here exploitation automatable and Technical impact and from those combinations you get 12 possible outputs and so as an example here if something was actively exploited we'd be going down on the
bottom node from exploitation if it's um High technical impact or if it's automatable and high technical impact we basically land on Leaf 12 and so that can be used as a score but really what you see relative to CVSs using those explo explotion data inputs you end up with a much more granular set of things to fix okay and when we are tasked with remediating or fixing things we want to fix the most important things the highest risk things first and have granularity of knowing what that is because ultimately we're constrain by our resources so something like SSP ssbc using the same data gives us that ability okay so the road map so the guide was released in March but there's
some things happening so we want to augment that Dynamic signal that I talked about earlier as a early warning and trying to understand well if a CVSs score changes how can we use that so I reached out to two folks who had written blog articles independently on this and I said hey this is cool why don't you contribute to uh the guide and tell us more about that so that's happening I didn't know these people reached out and said yeah cool we're doing it so Kristoff and Rudy are working on that very smart folks and that's happening now the other one is we can because epss is a probability we can aggregate scores and so we're working on that so these
are things that are happening on our road map okay wow wasn't that exciting so we cover a lot but ultimately what it comes down to is you know we know what EPS is what it gives us and how to use it and why we should use it um so the takeaways prioritizing vulnerabilities by exploitation does reduce cost and risk we focus on the things that really need to be fixed based on our available resources and we should refine our prioritization based on our data that that is really what it comes down to and that's what exploitation gives us that the other aspects of risk impact and exploitability don't that that's the key thing an epss is a key capability in the
absess of full list of here's all the exploited stuff you need to pick simple as that post um so there's a lot of code associated with the guide everything I showed was an extract from the guide it was just easy to click through this rather than me fumble scrolling around the guide which is online uh it's all there and more and the code to back this up all the data that and diagrams that we showed are all there so special thanks to Jay uh for allowing me to lead the effort and you know creating epss all the folks that did across the industry the thought leaders Yahoo for cultivating such a rich environment for people like me the
drive putting people first and the bsides crew ladine and all the crew that I've met and talked to and you um bsides is the conference that I like to talk at um it's a good crowd so thank you
Related talks
 29:41
29:41 22:17
22:17 20:12
20:12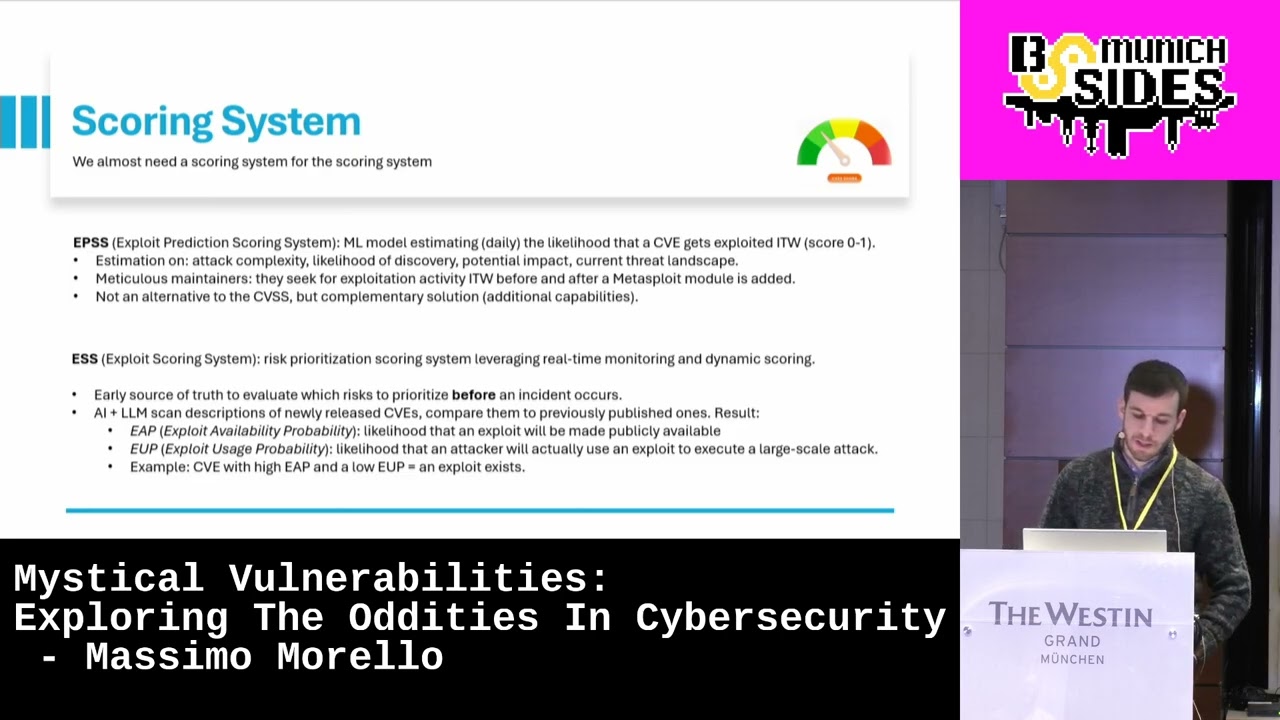 30:12
30:12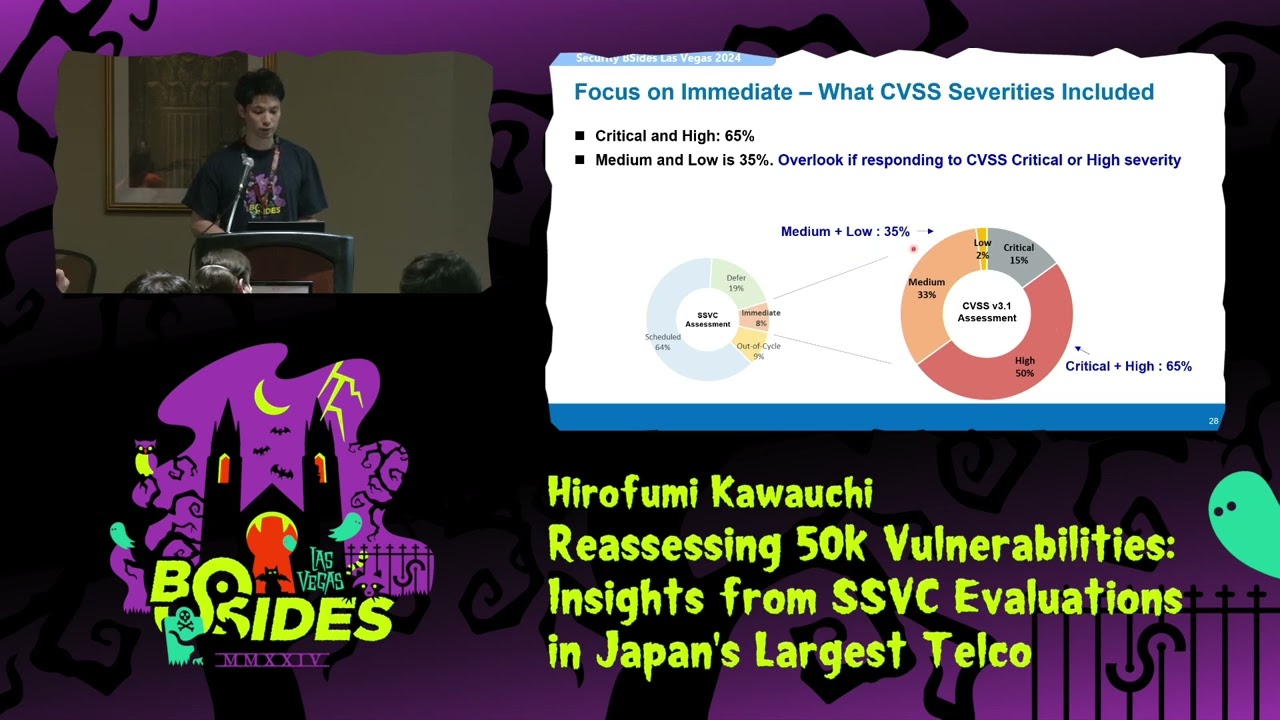 22:29
22:29 24:01
24:01