Fragmentation of Cyber Threat Intelligence
Show original YouTube description
Show transcript [en]
Please welcome Dave An. >> Thank you. Um it's a real pleasure to be here. I'm Dave and uh I wanted to thank uh Besides Las Vegas for offering me this opportunity to share a little bit of insight about uh what I'm passionate about. Um so uh the title of my talk is fragmentation of cyber threat intelligence. Uh we're going to go into a lot of data. So if you want to scoot up a little bit and try to look at the data a little bit better, please feel free. U the deck is stacked against defenders and you may be surprised at some of the data that I'm going to show you and uh it might help you rethink
about how cyber threat intelligence is making an impact in your organization. So who am I? Um I'm uh head of the intelligence services uh at Centrial. Um I've been with that company for about 15 years and I've been in cyber for a bit longer than that. Um I wanted to just thank uh the folks that are involved in this research. Um, so all these folks, you know, Aaron, Angel, Clark, Daniel, Daniel, and some Wake Forest University students. And of course, Centrial and our data partners who gave us access to all this data. Um, Centrial, my company, is one of the largest consumers of thread intelligence in the world, probably potentially larger than even the US government. Um, and we have a
community mission where we want to share some insights from the data that we possess in order to uh to give back to the community. Um the data represents facts and evidence that we have and the opinions are my own. Um hopefully you'll uh find them interesting. So I'm going to start out with a with a poll just maybe a quick raise of hands. So the question is what are the odds of winning the CTI game? What I mean by that is if you're using intelligence in defense of your networks, you know, um what chance do you think you have that that intelligence is going to help you stop an attacker? Can I get a raise of hands
in terms of how many think it's zero? 1 to 25%. Okay. 25 to 50. 50 to 75. 75 to 99. I assume nobody's at the 100, right? [laughter] All right. So, at the end of this talk, you might change your mind about what that number uh might look like for you. So, we're going to go over uh cyber thread intelligence. I'm going to assume that most of you know what it is. Uh we're going to go over all the producers grow globally in terms of who's producing it. We're going to talk about how much of that is accessible. In other words, can you buy it? Can you acquire? Can you use it for your defense?
How much is actually produced around the world that intelligence and at what speed? And then when I break that down into a number of super categories in terms of there's a hundred ways of describing the same threat. If you kind of normalize all that, what does all that intelligence kind of fall into? Then we'll get into duplication. In other words, how much overlap is there between providers? And then ambiguity. If they're telling you two different things about the same thing, how often does that happen? And then finally, we're going to pivot into a section of the talk around vulnerability coverage and speed analysis. So what that means is how quickly is intelligence being produced out there in response to
research or investigation or a threat that has been identified. Uh and then we'll have a couple of case studies to back up those those numbers. and then we'll have a couple of concluding thoughts with that. Yeah, it's it's going to be a lot. It's going to be a lot. Um, so hopefully you guys can digest it and I'll try to leave about five maybe five five minutes 10 minutes at the end for some questions. So today there are over 3,000 cyber security companies. There's a nice graphic put up by uh various marketing groups. Out of the 3,000 cyber security companies uh over 10% of them market some sort of intelligence capability. The number that we track uh
my research group tracks is 375 as of of this this month. So there are 375 commercial producers of intelligence that use intelligence in some way. They either sell it or they use it as part of their products. It doesn't include hundreds of government NGO um consortiums things like that like ISACS and ISOs. I mean there are a couple of hundred around the world. Um, there are of course hundreds of open-source intelligence that's produced by either very uh renowned or or well-known individuals, researchers who like to publish things in GitHub or maybe on Alien Vault or one of these platforms. Um, and then there are thousands of what we call transient active contributors. What that means is
these are researchers who are giving back to the community, but they're not that's not their primary objective. So they might you know publish something every couple of months track down you know some some some threat data publish some IoC's but they don't do that on a consistent basis and then of course there are tens of thousands if not hundreds of thousands of inactive OENT contributors so these are individuals who have done a one-time so they find something novel they publish it maybe they keep on top of it for a week maybe a few days or a month but then afterwards they just kind of move on and do their do their work. So out of all of this, how much is
accessible? So if you had all the money in the world, you had all the resources in the world, how much can you buy? How much would you acquire? Out of the 375 commercial providers, about 2thirds are actually closed. What that means is if you go up to a vendor that advertises a thread intelligence capability, you can't go in there and buy the data feed and pull it into your SIM or pull it into your firewall or anything like that. It's a closed ecosystem, but it doesn't mean that they don't have that intelligence. um out of hundreds of government and NOS's and and consortiums over 95% of them are affiliated with some restrictive um group right so if you're a healthcare
organization you can become a member of the healthcare ISAC but if you're not you can't get access to their data there are some organizations that do some data sharing and I'll get into that a little bit later but for the most part there's a lot of siloed organizations that cater towards small groups and Maybe they're doing that intelligence sharing very effectively, but they're not really necessarily sharing outside of that cohort and that becomes a problem or that can be a problem. Uh, of course, hundreds of prominent OEN individuals and and and and groups, they're all downloadable, accessible. But one of the caveats that I'd like to mention is that many of them, actually not some, but
many of them have moved on to non-commercial use restrictions. So what that means is as an individual or as an organization if you decide to download one of these open source feeds you can use them but if you're purchasing intelligence let's say through an aggregator or a third party who claims to make you may make a statement saying that they uh they have a lot of open source intelligence a lot of the times they may not have that open source intelligence that you have access to because of a commercial restriction. So that's something to be aware of. Excluding open source intelligence, uh less than 25% of global CTI providers, these are sources, not the actual data, but the
sources are actually accessible. So that's a minority. It's a significant minority and it contributes to some of the fragmentation that that uh that we're going to be digging into. However, there's a flip side of this which is we found very shocking in terms of threat context. Like out of the 25% of the data that you can acquire that those commercial sources account for over 95% of all global intelligence that you can actually get. And the reason for this is many of these uh intelligence providers focus on intelligence as a product and therefore they're generating millions if not hundreds of millions of data points whereas um the rest of the closed ecosystems they tend to have maybe a few
million data points that drive their products. So there is about 95% coverage even though there's 25% that's of the providers that are accessible. And unfortunately 99% or greater than 99% of all threat context that is produced in the world including open source and government is coming from the commercial sector. So if you're pulling in you know um you know uh the anti-infficient workg groupoup data or abuse.cch data or anything open source they may have millions of indicators but relative to the to the volume of commercial data they kind of represent less than 1% of the totality. So that's that's another eye openening uh statistic that we uh we uncovered. So for this study which has
been ongoing for several years uh we assessed for inclusion over 100 different commercial providers. We looked at all their data all their content uh we looked at over 100 open- source the primary producers of Intel uh and of course all of the available uh government NGO and consortium data that we had access to. So we don't have access to everything but this is represents everything that we could that's possibly acquirable and the focus of this research was to focus on indicators of attack and indicators of compromise. Now we all know that intelligence is not comprised entirely of indicators. There's a lot more intelligence than that. However, when you think about where the rub tire meets
the road, when you have when you're doing your investigations, one of the first things that you do is if you do a thread actor analysis and maybe techniques and TTP analysis and things like that, ultimately you're going to go to those indicators, pull them into your SIM, and then look at that intersection of what happened on your network versus what the intelligence tells you. So this the the indicators provide a neutral way to kind of standardize normalize and so I know it's a narrower view of of totality of intelligence but it gives us a a a an applesto apples comparison so to speak and uh the criteria for inclusion uh was that each provider had to pro to to to
provide at least 10,000 indicators and that they had to update those at least once a day. In other words, it's got to be actionable. And uh for this study, we had to have at least two years of historical data. Now, most of that we acquired, so we have it. But there were some providers that were excluded because they either could not give us access to two years of data or we didn't have that much. But it still represents quite a quite a big um uh set. So let's look at how much volume of intelligence is being produced by these 25% of acquirable intelligence. These numbers are staggering and we track this across 2023, 2024 and the first half of
2025 leading up to the end of June. So quote unquote feeds about 1,600 feeds back in 2023. Uh about 6.5 million updates. So updates are defined as when the providers instructed us to go get their data. Maybe it's once a day, maybe it's once an hour. However they produce the data and tell us to update, that's how many updates we we consumed. The 6.5 million updates delivered 851 billion indicators and threat context all of 2023. It's a very very massive number. And when we when we took that and uh dduplicated them across each provider and accounted for the the the temporal aspect of of of each indicator per provider that amounted to about 10 billion active actionable indicators
that the world of global CTI believes is usable. Doesn't necessarily mean that that's how many you can use, but 10 billion is roughly what's usable. In 2024 that number has increased pretty substantially. So the number of feeds and by feeds what I what we we describe feeds as being an integration. So some providers have let's say one feed that have 100 different categories or 100 different attributions. Others have 20 different feeds. So we kind of tried to normalize them. So think of it as 1,600 data sources across the providers. In 2024 that number almost doubled. So we have 3,000 feeds that produced about 8.6 6 million feed updates and 1.2 trillion indicator updates. So that's about a 50%
increase year-over-year. That still translates to about a 10% increase in total indicator volume right at any given moment in time. In 2025, we're actually on track to double almost double the 2024 numbers. U so the number of feeds is now up to 3500 and uh so far in the first 6 months about 4.7 million updates. So that'll probably hit about 9 to 10 million by the end of this year and almost 900 billion indicators that have been delivered produced by the intelligence ecosystem. And that right now translates to about 12 billion indicators that that are quote unquote actionable. So these are just pretty massive numbers. Oops. Um and let's look at duplication of global CTI. So all these
pro providers are producing this intelligence and how much overlap is there between these providers and to set the background for this you know a lot of providers advertise um their intelligence as being unique as a differentiator right so they're the best by whatever criteria they're the first um and in the marketing space I I think I've seen some numbers around 80% 70% being unique to each provider uh with 20 to 30% being uh maybe overlapping with others including open source. What is shocking is that based on an academic review of the data, the numbers are actually far worse. And we've been tracking this since 2019. So in 2019, the blended fidelity and we're using this blended fidelity number just to
kind of simplify this. And what we did was we tracked this across very blunt indicators. For example, IP addresses. Obviously every everybody's going to have information about IP addresses all the way down to URLs, additional context, TTPs. The more specific that you get, the more likely it is that there's not going to be any overlap. But the blended fidelity roughly gives you an idea of what are the chances that if you have two different providers that they're going to have some information covering the same threat. The numbers around 3 3 to 9% range uh back in 2019 and it hasn't gotten very much better. Right? In 2025 in the first quarter, it's hovering about 5.7%. And
if you look at the quarterly statistics over the last year and a half, two years, it's sitting at about 93%. So on average, you can pick any provider that's out there, whether it's commercial, open source, and you're going to have an probability overlap of somewhere around 5 to 6%. And then when you start to look into the context in terms of are they telling you the same thing at the same time, that number starts to dwindle down quite a bit. In fact, in some cases, especially for emerging threats that are relatively new, let's say within the last 30 days, the overlap tends to be less than 0.1%. So, these are it's it's it's a it's a
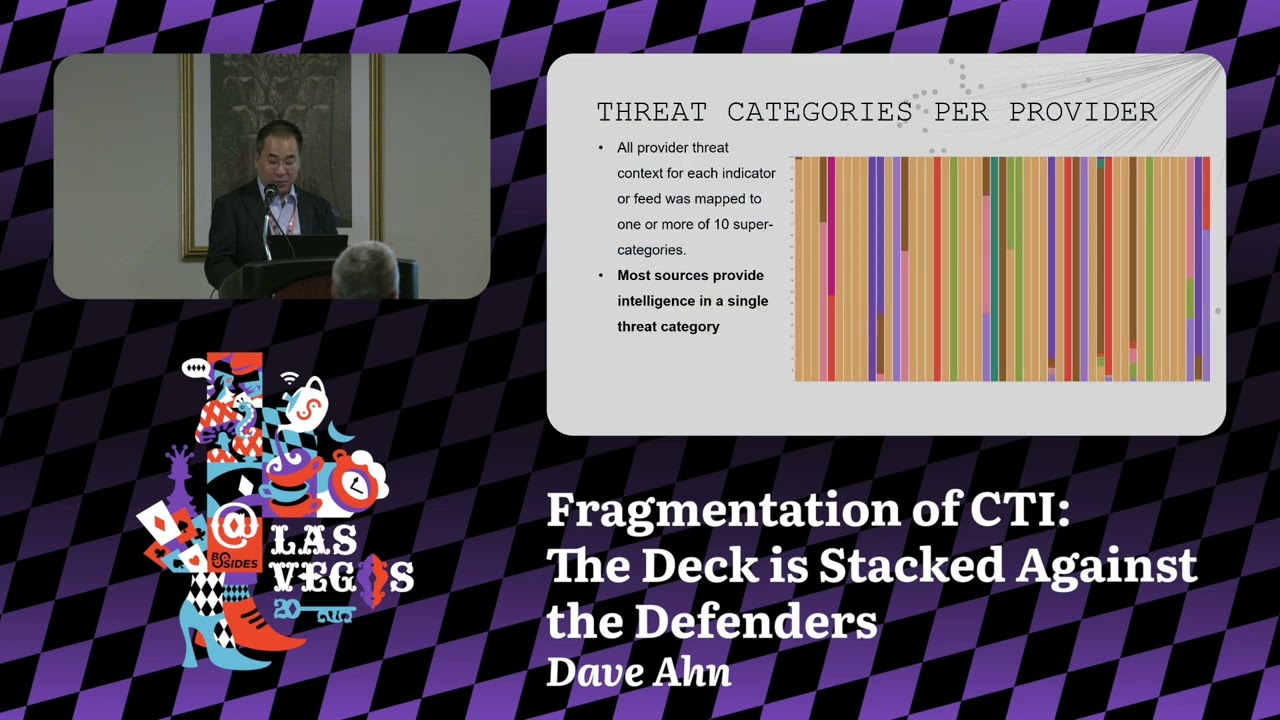
pretty amazing statistic. And there's only one or two academic journals that we were able to find that actually backs up our uh observations, and that was back in 2023. Back in 2020, uh there was a Xander Bowman had published some some limited analysis of a couple of commercial versus open source. Those also back up numbers. I mean 2.5 to 4% back then. So why is this occurring? So one of the lenses that we took was we took this global CTI data, the billions and billions of of of data points and then we categorized every single one of these into about 9 to 10 super categories. The supercategories mapped in some cases to the MITER. Well, in all
cases they mapped to the MITER framework, but certain categories like for reconnaissance that mapped into it, you know, very very clearly, but there are other like malware uh um you know, malicious delivery that actually encompasses a couple of different MITER attack um categories. But when we did this, this graphic represents each color being a particular threat category. And one thing that I'd like to encourage you to observe is that across the 50 or so commercial providers or C60, however many that are up here, most of them have a single color, right? If there are 10 categories, you would expect that most of them would have, I don't know, five, six, seven, eight, nine. But in fact, most of them
focus on a particular area. And so when you start to kind of ask the question, why is there so little overlap between providers? One of the reasons is that they all tend to focus on a specific area or areas of core competency and that leads to this fragmentation. In other words, you can pick any one of these providers but maybe one of them is only delivering u recon intelligence or fishing intelligence or other type of intelligence. And unless you're critical about what kind of coverage each provider has across your entire ecosystem of intelligence that you're consuming, you may be facing gaps. So let's dig a little bit further into what the data looks like. So out of the
10 categories, I know this is really really small, so uh there's a next slide that'll be easier to see, but I'd like to show you the the the color distribution. So back in 2023, the distribution you can see that there's about a third, a third, and 25%. Okay? In 2025 that has shifted quite a bit. There's two categories that have fully dominated representing some maybe around 75 80% of the intelligence data that's being produced. Now let's look at what that is. So in 2023 the number one category of intelligence production was in reconnaissance representing 30% followed by malicious deliver. malicious deliveries, anything that delivers malicious payload from an endpoint, you know, website, whatever it is. Um, and attempted zero day was also
pretty high in terms of about 18%. In 2025, that has shifted quite a bit. Now, the malicious delivery has shot up to number one at 48%. Followed by fishing, which is at 33%. And that makes sense because over the last several years there's been a lot of public analysis that fishing is the number one or certainly you know the top three attack vectors into every organization. So why is it that there isn't enough fishing intelligence malvertising also took a big rise and uh and it's up to 10%. And we'll kind of get into a little bit of of why this has occurred, but there's clearly a shift over the last year, year and a half in
terms of the focus of the intelligent production. Now, why are these relative numbers off? Let me show you. So, this represents the actual absolute intelligence that's being produced across the the last two years. And if you look at the numbers focused on let's say you know possible C2 or recon or resource hijacking they're actually relatively the same. What has happened is that there's been a huge increase in terms of uh the malicious delivery and the malvertising and the fishing. So it's not that there was a reduction in recon or other types of activity. is that there's more intelligence that's being produced to directly attribute against those top three threats. Another big driver behind why this has
occurred is that we observed in in early 2024 that a lot of intelligence producers were realizing that for example a daily cadence on fishing intelligence is probably not going to be that helpful because fishing intelligence well fishing campaigns typically get executed within hours if not minutes. And so there has been a a seismic shift in the intelligence produ production uh commercial space where more of that intelligence is being delivered closer to real time. So before if they were doing once a week to once a day in early 2024 they shifted to delivering once an hour if not once every 15 minutes or even 5 minutes and in some cases in real time. And this actually continues even
in early 2025. Uh even this past quarter there's been a number of other providers that have publicly announced real-time or equivalent type of feeds where they're delivering intelligence much more more quickly. Now you can see this is another lens in terms of that same tactic percentage breakdown across the quarters. So you can see that um relatively speaking the uh the the reconnaissance and these kind of factors have remained at roughly about they've diminished relative to each other. Uh but there's a huge increase in the uh the the the malware delivery and the um and um malvertising and and fishing um categories. This is another graphic that shows how that distribution changes across time. So let's look at a third lens.
Let's talk about ambiguity. So we now talked about um we covered how much intelligence is being produced, how much overlap there is across that intelligence data and within that overlap, how much ambiguity is there and the ambiguity is really really critical because when when you when you think about how analysts use intelligence and they use intelligence to pivot into an investigation, the wrong the false uh the the incorrect context will lead you down to a poor investigative path. path which results in wasted resources and false positive outcomes. We have observed that 16% of the time either one provider is giving multiple conflicting context about the same threat one provider or you have different providers that are giving different
opinions about the same threat. So if you're lucky enough to have the one provider that gives you different context, then maybe you can investigate a little bit further and help reduce the impact of the investigation earlier on. But if you only have one view from one provider and that opinion might be wrong or maybe it's incorrect based on the context of the actual payload that the traffic that's actually occurring, then that could lead you down to the wrong path. So that 16% number is actually fairly high. But the flip side of that is 84% of the time that intelligence is going to be pretty accurate. It's actually pretty good. Now let's look at that coverage
analysis. So if you accept this data that there's roughly around 5% overlap between providers then logic dictates that you need at least 20 providers commercial to reach at least 90% coverage against any arbitrary threat on a given day. It's just the pure numbers talking here. So if you have an intelligence program which is very welloiled, you've got a great team, you've got great tools, we've got great capabilities to operationalize, but if you only have a couple of commercial sources, a couple of government sources, and a couple of OSENT sources, then your chances of actually leveraging that intelligence to detect or prevent an attack that has intelligence somewhere in the world, probably less than 5%. If you're lucky,
maybe 10%, 15%. Depends on how much money how much how much data you have. So an overemphasis on quality could be moot if you don't have enough data to begin with. As I mentioned earlier, 84% of the indicators are unique context. So high CTI accuracy. There's a lot of focus and resistance towards using intelligence that could lead to false positivity. And so the focus ends up being gosh, you know, I've got a false positivity rate of 1 or two or 3% is causing me a lot of work and therefore I can't use that intelligence. But maybe a different lens to take a look at is well out of the 84% that is going to be highly accurate. What could
I use? What could I use that will help reduce the workload? And the last piece is that coverage for an active threat can take time and require a lot of accumulation. Um a lot of providers don't republish the same data if it doesn't change but it doesn't mean that the threat has disappeared. So what happens for example is that uh let's say they they discover a threat uh they attribute it they have a whole bunch of IOC's around it they publish it at t equals zero then they might do a little bit more research maybe they collect more data they might publish a few more over the next couple of days but then they stop
because now they've kind of moved on to the next thing and if you decide to age out those indicators because 30 days have passed and you don't think that's current then that could lead to a gap that you weren't expecting because if you go to that provider and ask them, well, this is 30-day old data, they might come back and say, well, we know it's 30 days old, but it's still valid, but they may not publish that to you. Another interesting uh thing that we learned from from our providers is that many of them don't include open- source equivalent context for the same threats that they're pro providing through the commercial intelligence. And the reason
for that is in part because they want to be a differentiator, right? So if they have open source data that tells them material the same thing it it it doesn't tell a good story. So a lot of the times they can they can often remove or not include the open source data which leads to further fragmentation. So then as a defender you have to account for that and say well do I should I and must I bring in that open source intelligence that is being excluded by the commercial providers in their offerings. So to summarize at least a part of some of these opinions around at least my opinions around why why is the CTI
industry or the ecosystem so fragmented I think there's a big part that is driven by the commercial aspects of it I mean of course it takes a lot of money money to produce intelligent takes a lot of resources and a lot of that telemetry that drives the CTI production comes from the ecosystem of those providers it's very rare from a total volume perspective that a significant portion of intelligence is coming from analysts, researchers who are doing work independently and publishing that, right? There's different data sources, right? So there are producers that focus on telemetry coming from their endpoints or maybe from their nextgen firewalls or they might have an army of a thousand analysts who are doing state actor
analysis and they're producing highly highly accurate highly tuned but also low probability hit intelligence for most enterprises right um they have c different customer bases they've got they operate in different parts of the world one of the things that we've uh we've observed is that given the exact same threat actor and the threat techniques and if we took two or three or four different intelligence providers that focused, for example, on firewall or endpoint or DNS, their data would look completely different. It's the exact same thread actor, exact same techniques, but those indicators would be different because one provider is operating, let's say, in Asia, another might be operating in Europe, another one might be operating in in North
America. And so that's where certain gaps can come. And it's a real problem because a lot of attackers are now leveraging conduiting tunneling capabilities to route their traffic through different continents. And so if you don't take into account these kind of um geographical um differences of these sources, you can have a gap. There are different observations of these attacks. Many of them, you know, if they only have an endpoint view or a network view or an analyst view, then their descriptions of the same threat can be very different. And all of this points to the fact that given the same threat, there may not be a very high level. In fact, there is not a high level of overlap between the
threat context. All right. Now, I'm going to pivot into temporal dynamics. And this is I think going to to be an eyeopener for you. So in 2023 and 2024 what we did was we looked at every CVE that was published in those two years and we culled them down to all the CVEes that had network-based threat indicators that we could normalize and attribute. And the goal here was to kind of ascertain all right when a CVE gets published how quickly does the Intel community commercial and open source attribute and protect against those vulnerabilities because without that attribution it becomes very difficult. Here's one example. bear recruiter vulnerability in 2023 public announcement in May uh 31st
percentage of total IOC count published uh by providers each day and you can see that this is a very common graphic so on the date of CV publication almost always there's a huge list of IOC's there's that that big spike right and then there's a huge lull drop down you can see across the first five or so days where there is really no more materially uh relevant IoC's that have been attributed and then there's a slow climb up all the way. Uh and here in this case back two years ago uh it took about 15 days for the intelligence community to catch up and reach about 60% coverage of the IOC that became known in the future.
So this is a historical analysis. We could do this because you know it's it's the future. In fact this is remarkably repeated across many of them. So we picked out four. Here's Move it, Invadi, Endpoint Manager, Metabase, Paper Cut. I mean, we looked at all the CDs, but they all follow an epidemic model. So, what that means is you can see a flat uh um portion of the graph that begins and that's the part where there's a lull. Attackers who have gained access to these vulnerabilities, they don't know what to do with it yet. they're fiercely most likely trying to exploit it, trying to build something and to leverage that exploit in mass. And we've
also found that certain CVEes that were more lucrative or maybe more accessible like those that are remote, you know, full rces, those kind of things, they tended to get greater attention and therefore they would lead to a greater influx of of new infrastructure that's stood up. So when we think about that speed of coverage um there's that lull and then there's a huge spike as the attackers are able to leverage those exploits and they stand up infrastructure or they pivot infrastructure and then it tapers off at the end because by 75 30 days into the future most organizations who are on top of their game will have patched will have responded will have done something.
So the time to reach on average 60% coverage actually ranged from 2 to 35 days and this was back in 2023 and time to reach 99% coverage of all known attack vectors to exploit this uh took about 45 to 60 days. So that kind of aligns with maybe some of the um other research that other um vendors have put out in terms of how long does it take to patch, how long does it take to discover, respond to a threat that's been announced. Typically tended to be in a couple of months, sometimes even up to 180 days. This really backs that up, but the intel industry is a little bit faster. Uh it was in in in 20 uh in 2023. The other
thing is is that the providers required to reach 100%. was somewhere between three and nine in these cases. So, you couldn't rely on one or two of these providers and hope that you had a chance. You actually had to have quite a few and they were random. It's not the same providers over again. So, I'm going to now pivot into predictive coverage. The previous graphic shows um what it looks like from a point of disclosure time equals zero into the future, right? And that's where the attribution comes in from from the providers. Now, what we did was for all of those CVs in in 2023 that we we analyzed, we looked back in time and said, "All right, let's forget
about the attribution for a moment. We know that nobody's no provider, no intelligence producer is going to attribute against the CB if it's not published." So, are those indicators that were actively being used to attack and exploit, were they present in intelligence for some other reason? And the answer to that is a resounding yes. If you see that line, the 100% line in orange predisclosure, that represents the line of 100% of all IoC's that are known in the future looking backwards. So at time equals 0 or time= t minus one, you can see that it's actually pretty flat. and even all the way up to negative 90 days or 3 months before disclosure that number is hovering
somewhere around 70%. So let's dig into that a little bit. Let's see. All right. So over 90% of all IoC's that are known in the future uh were already known or that are attributed in the future were already known and intelligence 7 days ahead of the disclosure time. So the intelligence industry has data. It's just that it's not attributed appropriately. And in fact 75% of IoC's are known 90 days leading up to the point of disclosure. they just had different attributions. So let's dig into that graphic a little bit. So that's 2023 and this is how that graphic has changed in 2024. So in 2023 it looks like this. You can see that it's very very flat
leading up to the the the point of disclosure in 2024. I'm going to point you to the two arrows and they represent two pivot points and the change in behavior in the attackers and how quickly the intelligence providers are actually keeping up with them. So in 2024 we did the exact same thing. We took all the CVS published in 2024 with network indicators and then we did the same analysis and what we found was that from a percentage perspective the prediction went down quite a lot and it wasn't because the indicators weren't there. We believe that it's because there's a greater proliferation of of of exploits against undisclosed threats ahead of the actual disclosure. So the first pivot point you can see the
first arrow representing around 40 days. We believe that that represents the first set of attackers who are probably in a closed ecosystem maybe who are sharing this exploit and trying to leverage it before the rest of the attacker space gets a hold of the exploit. So there's a bit of a spike and then there's a lull and then about 10 days beforehand there's another huge spike and that represents a second wave where those exploits and those techniques become more widely accessible to attackers and then they try to leverage that before the vulnerability is disclosed and vendors start patching and defenders start uh patching. It's a huge change in in behavior. But still, even in 2024, 7 days beforehand,
the data that isn't attributed yet, but which covers the attack vectors that are coming in trying to exploit it still sits above 90%. So that gives us about a seven minute or seven day time window to potentially use that that that data. So these numbers show you kind of summarize what I just mentioned. So the averages for 2023 and 2024 across other CDs, the number of providers that it took to reach 100% coverage of defense with attribution of a post vulnerability was around between 3 to 9 in 2023, but now in 2024 it has gone up uh to about 6 to 12. And in 2025, at least based on the first half of the data, it's looking
like it's going to increase even further. The number of days to reach peak coverage about 60% coverage that has actually improved quite a bit. Before it used to average at least 30 days or so, but now it's down to seven. The number of days to reach 99% coverage also has come down a little bit. Not as much as we would like, but from 45 to 60 days to about 45 days on average. Um, coverage of t-minus 30 days also went up. there's greater coverage closer to the point of disclosure, but once you move further out uh in front of time, t-minus 7, t-minus 90 days, there's less coverage because attackers are are basically on to this and they're trying to leverage
those exploits before they uh uh they can um they're patched. So, I'm going to show you a couple of quick case studies. I've got a couple of minutes left. So, this is Blackbasa um ransomware as a service variant. And of course, initial access sphere fishing, vulnerability exploitation and so forth. And this represents the different providers that offered coverage at the time of disclosure. So it took about eight providers to get to 100% coverage. You can see the graphic that again it mirrors what I just mentioned in terms of the average. You tend to have somewhere between 80 70 90% uh predictive capability about seven days or so. Uh ahead greater than 90% known tus 15 days. 95% known already at t
equals 0 days. This is the distribution of different providers and the IFC coverage across them. And the interesting thing is is that prior to disclosure, the attribution was this. So they said that it was either C2 or malware delivery, other risks, fishing. This was before the proper attribution to that particular threat actor. And the same is true uh for Quarkbot Radomenthus info stealer. You can see the graphic, the Luma dealer. This one is a little bit steep. Um, it ramps up much more quickly and on and on. The average time to coverage 4 days, 90% known within within six days of disclosure. So the key takeaways from the study is that there's a lot of um
advice or desire to throw away old data because it's older than 7 days or or or or two weeks or 30 days. But if you do that without understanding the context of what you're throwing away, you could be creating that gap. You could be creating that opportunity for the attacker to leverage something that you felt was unusable. Some concluding thoughts. Um the odds are not in our favor based on this data. We have we're getting too much data that's being produced and it's happening too quickly, too fast. Um there's a profound impact in terms of realizable benefits uh for CTI. The best sock with handpicked CTI can fail because there's not enough data. And the assumptions
about what is best, what is actionable might be different based on this data that you've uh you've just heard today. um CTI analysis engineering is a huge huge hurdle and do the attackers win? Uh the game isn't over yet, but I think with this data, I hope that it gives you a little bit more insight into how to better leverage the intelligence and and ask questions about how that intelligence should be used in your environment. So, what are the odds? We estimate that it's actually probably around 5%. With that, thank you very much for your time. I don't know if I have a minute or two for questions. [applause] >> Do we have any questions?
>> Yes.
>> Uh really interesting presentation. Uh um thank you very much first of all. Um second of all uh on the topic of predictive right there are some vendors who are now saying you know we're seeing signs like grey noise for example right they're seeing oh we're seeing scans of of these kind of devices on our network we don't know about any vulnerabilities but this is a leading indicator of something has been discovered and now they're doing that that seems to correlate maybe that's going to be like one of your step ups one of your stepups there what do you think about that you think that's a valuable insight, something to take into account with our thread intel providers?
>> Yes, absolutely. Um, so I did read that great noise report. It's a really fantastic report. If you haven't seen it yet, please please do that. And it definitely backs up what we some of the numbers that we've seen. In fact, we see the predictive aspect of it much further down because we're looking at so much intelligence across the entire ecosystem. But it does represent our opinion that attackers are gaining access to exploits much much earlier than we expect. So it's not that once the vulnerability comes out and hits media that that's the point in which you have to respond. You actually have to respond ahead of that and you've basically got a window of about 7 days.
7 days before and maybe a few days after the point of disclosure. So I think you're absolutely right that they're they're iterating over reconnaissance trying to identify the assets that could be used that could be exploited and that is absolutely predictive. If you can defend against those detections, if you can find them ahead of the time, then that buys you time to patch. And a lot of the times you're not going to have access to those patches from the vendor until the point of disclosure or maybe a few days earlier. So, it's absolutely correct. And I think this is going to continue to get um I should say worse from a defender's perspective um but
maybe better for the attackers because it's so easy to scale up and leverage these kind of attacks at scale. >> Any more questions?
Thank you. So to that slide where it looked like indicators 40 days ahead and then 7 days, did you dig into that data any further to see if there were nuances to the things that were disclosed on average 40 days ahead versus thing or were being kind of poked at 40 days ahead versus things that were being poked at later? cuz I and the context is I'm wondering if it's possible that those are state type attacks where they start using it ahead of time and they use it and then when they feel that it's become burned they immediately hit everything they can and then that leads relatively quickly to um disclosure and such. And so I'm
wondering if there's if there's any kind of multiple characteristics within that or all vulnerabilities generally kind of followed that path. >> So yes, absolutely. So the what's really interesting is that and that's that's an area of research that we're doing right now and it's probably a follow-up um you know session that that we'll try to do uh next time. we'll do. Um, but what we've noticed is that uh we've been doing a lot of predictive analysis and in terms of what are the attributions that occur historically and how do they lead to potential future attribution of a particular type of vulnerability that's disclosed and there is a pattern. In fact, we we we're currently able to
predict about 88 to 92% based on two years of historical data. And what's really surprising is that and there's a graphic right here that I'm I'm pointing to here is that the red line represents the pivot. That's new infrastructure that's stood up. So that's never been seen before in the last two years for this attack for this particular set of data. And what you're seeing is that the pivot happens very very rapidly. In fact, it's happening earlier. So what's what's what seems to be occurring is that attackers are leveraging existing infrastructure to immediately exploit because it's easy to stand that up. it's already there. All they have to do is just pivot the uh the the software. But
then once they materialize and they have an exploit that's working, that's at scale or scalable, then they pivot to ramping up that attack vector in terms of new infrastructure and that has not been seen in two years. I know. Um, is that that the same attack threat actors are pivoting or switching to new infrastructure or is that likely the new attackers coming into the ecosystem now that they're aware and that's why the infrastructure looks new? >> That could absolutely be the case. So that's that's a little bit harder to discern in terms of whether they're sophisticated actors or whether they're script kitties for for lack of a better word. But what is very clear is that
you've seen some of these graphics where the uh the pivot is extremely extremely steep. So you can see here uh you know for the graphic on the bottom left that pivot happens within just a couple of days and it spikes up multiple X and so it really depends on the type of exploit and it depends on the vulnerability and the exploitability. In other words, there's a lot there's an a monetization aspect of this that's probably driving in terms of if it's a ransomware type of uh or data accessration kind of attack, then those will lead to more monetization and therefore there's going to be a greater attempt at trying to exploit those. So I think there's some
really area interesting area of research to help further use this historical data to predict against future attacks. >> Thank you. >> That can Sorry, we're out of time. All right, >> that concludes this session. Thank you, David. >> Thank you very much for your time.
Related talks
 54:05
54:05 27:37
27:37 16:22
16:22 8:26:49
 40:18
40:18 22:22
22:22