Detecting Network Beaconing With Convolutional Networks And Zeek Logs by Ignacio Arnaldo
Show transcript [en]
yeah thanks for having me so first of all like a disclaimer I I'm a data scientist by trade and I've been working at the intersection of data science and cyber security and specifically network security for a few years but um I'm sure you'll know much more than me about some other things I'm going to discuss so feel free to chime in or or correct me a minute hopefully you can see this block because I think I try to make the talk very Visual and what I'm trying to display here is basically sequences of connections or active or network activities over time and just to get a visual understanding of whether things are picking in or not so this would be
like a timeline of how a Bitcoin looks like over time and this will be the distribution of the intervals between activities so you could rightly see that it must be concentrated in specific duration it's probably an indicator and also perhaps before I move forward like I wanted to do like a quick pull to see how many are familiar with these two things with seek like formerly bro the network security monitoring okay so basically it's it's a big project but basically it's a tool that allows you to monitor a network and it extracts like a series of logs that are useful for threat detection or incident response and then it is it's also configurable so it has like the possibility to do you
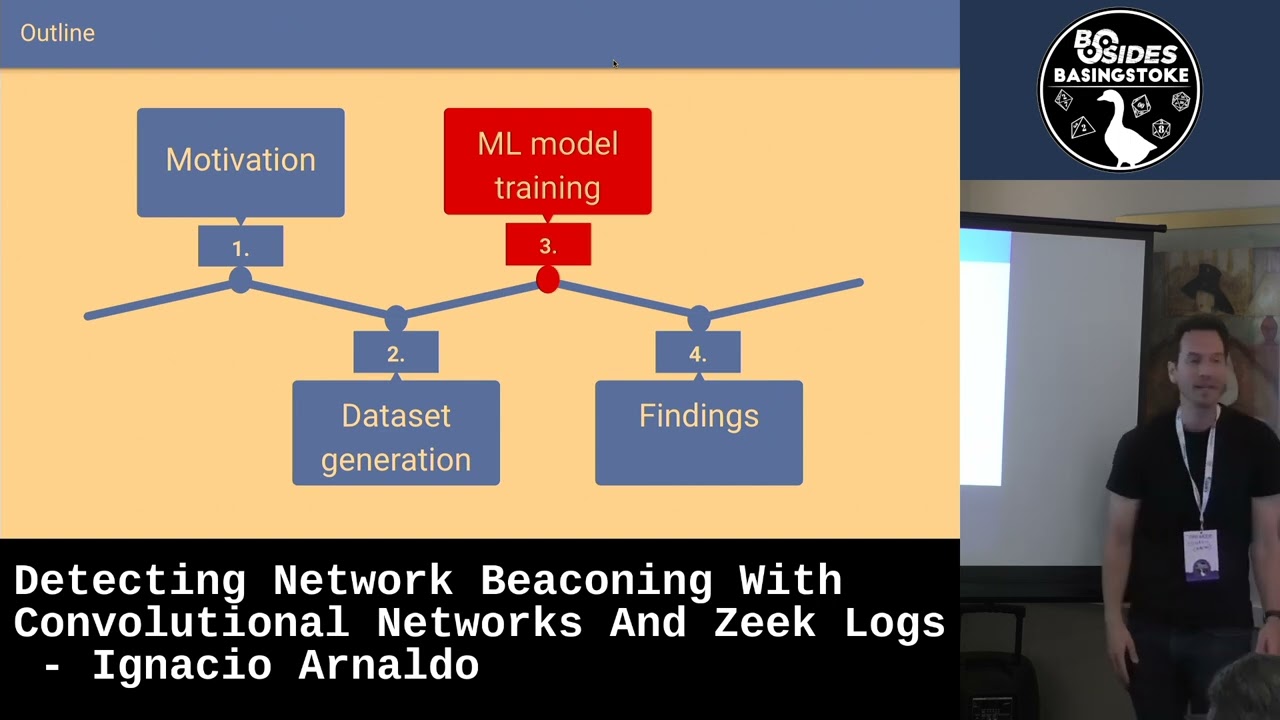
write your own scripts and everything and I'm going to focus mostly on the logs that it generates and how we can leverage those and then Keras enters the flow and machine machine learning in general like has anyone played with uh to build some detections or whatnot okay cool so yeah so first of all the motivation then I'm gonna go into how we have built the data set to train models that can identify beacons and how the model is actually trained and then some of the findings in my own home lab which is basically my own home connection so you get to be a little bit nosy nosy and and see what's going on at home and then
also some pickups that I found out there [Music] so for me at least it started like trying to identify C2 Frameworks where and you tend to have like a C2 server and then some compromise machine or victim machines that is beaconing now to the C2 server and basically requesting comments right I'm saying do you have any comment for me if you have it send it and then I'll execute it and then give you back the result foreign with a number of these to try to see what the network activity looks like or the traces look like like Caldera interpreter within the meta space Frameworks lever Empire couple strike and in the realities that there's actually many of these so this is a very
good resource the C2 metrics and it basically lists like like 130 plus Frameworks or so and then you have like a lot of tutorials out there on how to set those up to be able to create your own cities and this is a snapshot of what color in particular looks like and what is interesting to me at least from a data perspective is that you generally have like when you run one of these Frameworks like a Bitcoin in Period where you have the victim machine that is becoming out inside you have commands do you have comments you have commands every now and then right and that tends to be periodic and then if there are
commands that you'd see these spikes or there are interactions and there's more back and forth more connections more more data being sent and received and the different Frameworks have different ways to configure this where for example on the left I don't know if you can see it but basically that's called there that has a nice UI you can enter the Bitcoin in frequency and you can additionally enter like a detour parameter that will make it like more random and they call that like a stealthy parameter or sales parameter Empire has the same thing again not sure if you can see but you have like different listeners that you can set up over different channels like HTTP DN s
and many others and one of the commands you have is like the default delay I think or sorry the one of the commands is the delay and the Jitter I think by default is five seconds without Jitter but you can you're free to go and change it and interpreter has the same I think the default for that is 10 seconds this is just another example with sliver where Hira was playing with generating a Bitcoin for a Linux machine that would reach out to that IP every 30 seconds with a Jitter of 5 and what that means if you look at these timestamps is that the requests are going to be roughly every 30 seconds but they could be up to
20 or up to 35 and 5 and down to 20 sorry I have to up to 35 and down to 25. so there's going to be some variants that is going to make the detection a little bit more difficult so if we summarize these observations we know that we have a lot of Frameworks so built-in very specific signatures is going to be a challenge um they all at some point need to have like those Deeper Life beacons and the periodicity changes a lot mostly it's configurable and the defaults also vary so it's going to go from days to from from days to seconds right and optionally you're gonna have Jitter then on top of that you have different
channels because you have to monitor like HTTP traffic but also DNS SSH and many others and you're going to have these mixtures of the Bitcoin videos where it's just going to be reaching out for commands and the interactions when the C2 the attacker at the other side might send some commands or or Scripts and then you have the additional issue that even if the beacon was perfect you might have like some latencies or network measure measurements that were actually gonna modify a little bit of the timestamps so for me the idea was can we build like some genetic detection that will work across all of them and for that we're going to be focusing on only on the timestamps because if we
were to write information and so we would not be able to do that easily across all channels and the realization for me was that okay I know how do you speak on in logic works I can actually recreate it myself and just generate like a million or 10 million examples like covering like a wide range of frequencies of G train of deeper and and latencies so that then I can train a model that will actually have learned from a lot of variations of those items foreign so with that we can go into the data set generation and the idea for training and machine learning model is that you need to provide it with examples of what
Bitcoin looks like with as much variety as you can and also examples of what normal connections has in non-beacon and look like as well right so I created like a quick heuristic to generate those examples so the first thing is it's going to sample whether we're going to create a beaconin example or a non-bitonin example if we if we sample that it's going to be a becoming an example it's going to sample again whether it's going to have gitor or not and I'm going to generate like a series of sequences with decoding with Jitter and Bitcoin without heater and then for the negative class or the negative examples it's going to be mostly random sequences
and I had to set some boundaries here so I decided to add initially at least look at only 24 hours worth of data and within those 24 hours like the first event would also be sample like anywhere between the beginning of the day and the end of the day or beginning of the 24 hours and end of the 24 hours for the frequency range of the period I took 10 seconds all the way to four hours just to get a starting point so my idea was to cover or detect beacons that had a periodicity from 10 to 4 hours 10 seconds to four hours and then for the G train again some parameters like you want to make it noisy but perhaps
not too noisy so that it's very very difficult to identify the people and for the network latency I just applied some random noise that where the beacon could happen like anywhere between minus two seconds to plus two seconds in time and just to get an intuition of what the examples would look like and in other words synthetically generated like these are like what we could call perfect pecans except for the network latency where you would see like something for example with a beaconing uh the something that becomes every 16 seconds of course if I plot this in like over 24 hours it just looks like a straight line but if you look at the distribution of the intervals it's
centered at 16 and you see like like like a few seconds like back and forth where the intervals like and then if you pick a longer sequence it will be I guess like 40 minutes or so and that's what it would look like over 10 so here you can really see a pattern and then same for like close to four hours I guess this is what it would look like and this should be the easy ones to detect uh these are the ones that would have like some noise so this is with Beacon input with Jitter so again like another picon with a short frequency but with more detail it means that this distribution is going to be a little bit
more stressed so there's going to be more variants in the in the intervals between activities and then if you go to longer pecans or longer frequencies you see how some of these dots are more separated than others not just because there's some Randomness in when the activity happens and same here and this is with with due to that again but with very with a very small Jeep so it's going to look almost like a percent so it covers the White Range and I did this repeatedly so I just generated like random sequences or or many sequences of Peter up to like 500 000 or so just to have an enough representative example and for the negative examples it's just
mostly random sequences that could have like activities over a split over 24 hours in randomized and of course the mortgage generator the more variants you have the better for the model but they could be anything like like activities concentrated just at the end of the day or at the beginning or scattered as well and one one more trick that that I did is instead of actually looking at these as an example for the machine learning more like the 24 hours I actually looked at the intervals just because it gives you some robustness to where it starts in the day so so you can actually be focusing on the distances or time drain time intervals between activities rather
than when they start in the day and another trick also for the specifics of the machine learning model that were used I actually scale them down from seconds to to a lower value to lower values that's going to help like the machine learning mode itself okay so now we have a data set with positive examples and negative examples and it's where the the magic happens with the with the CNN with the convolutional neural Nets so the idea that that I had is that we can leverage some of these deep learning models that look at patterns right and listening to work very well for images or for time series the idea is that you have examples in your data of what
like Bitcoin looks like in in what non-beaconin looks like but you don't really want know how to quantify that right so you're basically going to be feeling examples and you're going to create an effort that says okay learn some patterns right uh can identify like like combinations or sequences of four to five consecutive sequences that look like Bitcoin and you're going to be creating or you're going to be declaring those and you're going to be anything that the network actually learn a few or the calls filters or functions that try to match specific patterns in this case we're seeing a Network that has like one and well three functions it's going to be taken a specific filter and moving it
throughout the sequence like one time with them again and when the input sequence matches one of those filters it's going to generate the high output right in this case we'll have like three functions here so you see that this this is moving as it moves you're generating like outputs in the next layer and the depictions shows actually three that is three functions because we've seen three rows here but we can do like we can run as many patterns as we want in the particular example I I I'm going to show next I think it's like 16 or 32 different functions and the ideas are the same function the same filter is going to be moved
throughout the sequence and so we can actually detect like beacons in different areas of the of the sequence it doesn't have to be at a specific location so even if we had a sequence of activities that had become in at the beginning but not at the end because we're moving those papers we should be able to do that victims as well so this is the model specification when it comes down to it is a fairly simple specification with with catas in this case and the key pieces is that it has like two layers of these convolutional filters the first one is going to have 32 filters which means that we're going to learn 32 patterns of what Bitcoin looks
like and then it's going to be like another layer that is going to look at the outputs of those papers and then we're going to learn like six more filters and then we're gonna like add some more layers just to be able to train a classifier and the classifier in this case is going to provide two outputs one output is going to say whether the the the activity has weakening in it and the other is going to say whether it has Jitter or not so by combining those two outputs we can identify beacons without Jitter beacons and be conspic Theta or non-bikant I'm also limiting it in this case to the first 100 activities in a sequence so if
we wanted to to score or analyze sequences that have more activity we would have to move that window over the head to cover to cover all the activities and on my toy or synthetic data set like the model seems to be learning well so this is a confusion metric it's basically kind of showing it's showing like the the Heats and the misses of of the model for both the Bitcoin in output and the Jitter output so if you select the numbers like the vast majority of cases fall in the in the yellow cell so basically when it was negative it said negative most of the times and then when it was positive it said positive most of
the times in both cases for the G2 it gets a little bit more confused but I think it's still fairly good fairly good results and of course this is on the toy data set I think what's interesting is to see what happens when we actually put this in in our to work with with real data so for for that I actually use my my home lab where I have like a zika instance deployed and this is where I have like basically a sensor that is logging all the network traffic that is headboard that is going through or before my character any particular for this case I will I focused on connection though CNS HTTP and SSL by the way Zeke actually logs
mostly like everything in the connection log you're gonna have like all TCP UDP and icmp there but then this logs are specific to different protocols so HTTP is going to have its own load as I said it's going to have its own DNS and this there's a median of those it's like 50 different logs that you can get so it's very detailed information per protocol as well um what I did in this case is I took like the timestamps of each of those events and then like I tried to model like source and destination so basically each sequence is going to be defined by um like a source and the destination and 24 hours worth of connections between
them in the case of connection logs you you have like the source and destination IPS in the case of DNS you can look at the source IP and the query that was done because in that case the distinction of the amount of D might be some DNA server so now that is as interesting and I also broke the analysis based on the Response Code or the DNS queries that resolve versus the ones that didn't and for HTTP you can also take for example The Source IP and the hostname or the destination appearance a choice and same for us itself in that case I took the source IP and the server name of of the certificate
and these are some results that I got at home so I first started looking at DNS traffic and looking at all the requests that actually resolved with no error Response Code and what I had like was an output like the like floated in that graph that shows on the y-axis How likely it is to be beaconing in and on the sorry on the x-axis How likely is the baby connected on the y-axis How likely it is to have Jitter so the lower corner is actually saying those are beacons without eater and the upper right corner is saying those are beacons with cheetah so if we look at something like what the like a beacon without it or it looks like it's
something like this and then I identified like perhaps and surprisingly like beacons to all Zone and if it'll work so the time sync um which I think was expected but I also identified like quite a few more things for example I had like the time apple.com or time windows open again like syncing time and that happened like every every hour or nothing and then this one was a fun one for me fun one like the Honeywell this is actually like the Honeywell Home that actually allows me to control my my heating remotely right so it is actually like some kind of C2 framework because I can pull up my app and now change um the radiators and so on so I think
it's I haven't deep dived into it it's probably doing the same thing as a C2 framework but it's actually reconing out every now and then and I would expect it to be listening for commands from the app to then change the heating configurations this is a wiffy Wi-Fi extender and this is like calling to the pro DNS server it'll be 30 seconds as well and then perhaps where it's more interesting to analyze this to this is a longer tail many times of these findings with jittering but you can see how there are some sequences that have some weakening activities but it's not perfect over time right so in that one for example you see that there are gaps
or maybe the activity was not beginning all the time so if you look at the frequencies many times you're gonna see that either straight across um across different periods but I think it's also important to surface things right because you the fact that it didn't become like all the time doesn't make it less interesting and this one too it's difficult to I mean you can see it here but what's happening is that there's actually several connections closing time and then some that are more spread so so you can see like the big jumps are these guys here and I think it's every hour or so and then you've had like a lot of connections that are
close to each other I think it's important to also surface those those panels
okay so what I did another analysis and and I said I flagged myself so so this is DNS request that actually don't resolve and this is generally like I have found like a good indicator of of issues many times and just because malware sometimes has like hard-coded domains that are no longer active or not yet active so if you look for those patterns you sometimes surface those and you can also surface misconfiguration so it's also a good hygiene use and in this particular case what I did just to make sure that the thing was working is I created like a simple script that would actually look up a domain that doesn't exist every 30 seconds is to see whether it would
surface it and and it did and another of the ntp servers was not responding for some reason but you could also see that sometimes
so you can you can do the same analysis over the different protocols in this case it was used in SSL and I was looking at the pairs of source IPS to server names and in this case what it surfaces the Google safe browsing API so only we have used this but basically you can have a local copy of the Google say person database or something like that that is going to update every 30 seconds with like malicious domains and AP so that you can do local lookups um so so it resurfaces despite the fact that the the the the updates didn't happen exactly every 30 seconds so there was like a little bit of variance and it
was able to surface them um and then I I also sometimes listen to the search stream stream as well so that also was found this is actually like the the seek sensor that I'm using that is sending Telemetry out so it also identify that and something that was also interesting is that the sequencer was also not perfect so this areas where there's more activity and in areas where the beacons are more spread the model somehow had also learned to identify that and the other one was homeo which is like scenes what I'm sending some some of these thoughts as well and finally I did it like I I found like a malware pickup of zero so it might be
a little bit dated by now in in a in a post by active content measures so this they do a lot of analysis with Zeke as well and they also talk about pickling so I think it's a great resource and this particular pickup had like a trace of Zeus basically for 24 hours and they basically use that as an example to demo some of the bikini detections so I did the same and sure enough it identified some beacons and without G30 and identified like connections to weather.microsoft.com and here see how like the the activity happens only like in the last half or last third of of the 24 hours but remember because we were looking at intervals and not really
starts they gave us some robustness to that and then like the I guess the malicious domains that they were trying to identify was that second one like the one Life Sciences or whatnot that is still reported on virus solo then that one was beginning every 30 seconds so it actually only happened at one point after 24 hours that was shown here but I zoomed in in there just to see like the sequence what it looked like and it was fairly straightforward every 30 seconds and then it identified all the things like Windows updates and so on so I have also tried these at higher scale like in production environments and so on and and I my experience is
that it's good to identify these C2 Frameworks but this the reality is that there's many things that actually become out so I think it's more of a good like a building block that can give like more complex detections and yeah so things like uh connectivity checks service updates um many actually legitimate big concept would be like like my Honeywell at home and so on so all of those and then like a lot of the detections that I had found and were looking for these perfect intervals between sequences and I think the reality is a little bit more messy so if we only look for those I think we're going to be missing on many interesting activities
so I think it's important to have some flexibility and cnns I have found that are good at that because you're not really specifying upfront whatever those patterns are that you need to look for you're just sending the data with that variation and letting the model identify those patterns for you and I think the last thing is that I think this approach can be identified to Authority and can be adapted to servers like other patterns that are not necessarily becomes like for example this was a sleeper session where it had entered like a remote this is a promotion and I think it's configured to basically have like exponential delays or incremental delays so basically it's going to wait for a few seconds for a
command if it doesn't get a comment it's going to wait for twice as much and then twice that as much and then wait for a long time so you see that the connections are straight like further and further until there's a big jump and that whole pattern repeats again and again right so those could also be good indicators of some of these of some of these three questions so that's what I had like if you have questions over experiences detecting these things and I will be very interested
[Applause] like what kind of ant at all could you create to be less obvious yeah so I think where the model failed is where there is a lot more variance in or or the the rate here if you want from the period to the Jitter is very high or very basically if you have like a lot of Jitter maybe period like a sequencer that Jitters every 10 seconds but where the variance is huge right that messes up with with a with a model so I tried ranging from 10 000 examples to all the way to a million but I could generate this as many decision sorry about one million percent I don't know 30 I think exactly
also had a lot of Peaks at zero so maybe you want to increase your simulation let's say the chance for actually when you have one connection it uses two four five things yeah otherwise
yeah that is true actually so so you mean at zero like zero interval or zero back uh like three slides I think it was I don't know we'll use that one so Windows update right yeah it is a beacon it's gone a little bit over there but also he created multiple connections at a time yeah so you've got a big peak of zero on the left there yeah yeah you're simulated beacons you'll never have to keep the zero but lots of things will actually send out a handful of packets or a handful connections yeah to your simulation or it might not just send one thing it might send five things there yeah I think so yeah well I think I have
also seen where people bucketize some of the connections and they look uh they basically group all of those together so I think that's a good thing
see the clashes crash it out URL IP address correlation between this transaction into this transaction okay so so I haven't it's more difficult to generate like those examples so I have seen that with my own eyes but it's very difficult because all those Frameworks like generate like slightly different patterns so what I thought is that if we could focus on the beaconin sequence maybe that's a very strong signal like a in a more robust signal across all the Frameworks but yeah but I think the the ideas are not only you need to identify that but also what happens next and that's also part of the reason why I wanted to be able to even in a longer sequence if at some point of
the sequencer was becoming I was I wanted to be able to find it two questions
yeah so I think it depends on the protocol for example DNS um in Zeke at least you have like one lock for every request so I was doing it at the request level yeah but if for other protocols I don't know we'll have to see the specifics um yeah so did you see this kind of um running on kind of uh intelligence in a knot where they're getting locked in from from sequence various people and then they can you can make manual maybe automatic responses like um turning understanding profile although maybe was business value of frequency is that something New Jersey um or is this just so on the data set yeah so these I have to only completely
outside Zig so I took like the z-clocks as an input and then like this like a layer of Analytics use the trade model against the library yeah yeah so I think the the thing is you would have to somehow maintain like a 24 hour window of the of the timestamp so in practice when I have done that I have filtered down the logs like with some heuristics trying to say okay for HTTP I'm only going to focus on host names that contain domains that are not popular for example because otherwise the loads it comes like here you basically need to maintain all the traffic
of people using Zeke together with Zeke broker to then like send to other tools so you don't really need to do the machine learning PSNC you can actually with broker send Zeke like events outside Zig then process it elsewhere and then send it back and any in seek you can maintain tables and memory with X on some over cache of of activities and tensors against the live stream they um that those hours
or terabytes worth of data [Music]
yes archives
Related talks
 24:40
24:40 34:05
34:05 37:55
37:55 37:50
37:50 24:18
24:18 28:35
28:35