Feeding the Shark
Show transcript [en]
so beating the shark capturing packets for analysis that's what we're talking about today so if you're expecting something with coding it's not it we just summarized my bio so I won't spend a ton of time on this um I'm a founding member with some of the other great guys in this room of dc801 801 Labs local hacker space so if you guys haven't checked out the hacker space in Salt Lake please do come out say hi and occasionally I will monitor Sans courses as they came up specifically 542 and 560 which is web app pen testing and network pen testing so uh oh one more thing is hacker Camp it's an annual event we do every year
where we all get together out in the middle of nowhere and take on a bunch of high-tech low-tech hacking challenges sort of off-grid so there'll be some announcements coming out we're hoping to do that again this year in June so here's what we're going to talk about today we're going to talk about how to get packets and where to get packets uh we're going to use a packet capture analysis tool to dive into a couple different scenarios and figure out what's going on with our Network it's it's some real world examples that I've pulled out of my personal experience where you want to dig into a network device or a server and figure out what's
happening at the network layer is becoming more important especially as we see more and more virtualization compartmentalized I.T groups where you don't always have access to rip the wire out of the socket and put a tap in line so we're not going to spend a ton of time in Wireshark I'm going to give you some Wireshark resources but we're not focused on Wireshark specifically today we're talking about how to get the packets uh this Talk's going to be freely available there's a link at the end of it you can download the Talk and there's a couple of resources with it so don't worry about scribbling down notes if you see a link on here the whole
presentation will be available in PowerPoint format keynote format for anybody else uses that goofy program uh PDF for those of us who don't want to deal with slides and it's just one big zip file on the site so so a key point for today is we're talking about non-invasive packet capture techniques which how we can get traffic without ripping the wire out of the wall without doing a physical tap without calling up our bodies at the NSA and asking for their copy of our traffic so we want to dive into a production system pull our traffic out analyze it offline and determine what's going on so in this room is anybody brand new to Wireshark never used Wireshark no idea
not real experience Jason okay we'll talk afterwards if you're new to Wireshark here's some great resources um like I couldn't exclude left shark had to come out that was just a gift we needed left shark if you don't know who left shark is Google it up it's pretty entertaining um there is that so the Wireshark Vlog talks about all the latest things that are happening uh Wireshark documentation is deep but it's very good um there is a whole system of classes that you can take attached to the water shark website and I think the first three courses are free so you can sign up and get some familiar with shifting through Network traffic I think Lord
Chappelle has her own little University she writes a lot of books uh and there's shark Fest if you really want to go full nerd on this stuff you can go to sharkfest but they publish all their slides the presentations or documents from previous years they have that the Computer History Museum in California every year so lots of great content if you want to dive deep with Wireshark so why do we want packets uh well let's think about what pack guitar pack is the traffic it's the actual traffic it's it's not a log it's not an SNMP trap it's not netflow these are evidence of traffic the packet is the traffic so if we have the ability to dive in and
actually get the traffic from our device we can see what it looks like in transit and what it looks like as it arrives to its Target moving on to why we care about where the packets come from so does anybody in here not know what the OSI model is no shame just Danny I know I know we'll get you there same two guys perfect weed patch okay it's genuine engagement with the audience yes well I understand that's that's why we start with mimosas um so the OSI model right the fundamental concept Network building blocks helps us understand the layers that our traffic goes through as it leaves one machine crosses the network and is built up in
another the way networking works is your traffic has to change in transit right Mac addresses will change as you go through layer three boundaries if you're going through Nat devices addresses are going to change sometimes protocols might be modified if you're going through ips's or proxies so where we look at the traffic is going to change what the traffic actually looks like that's why it's valuable to have the skill set to go into a variety of different places on your network and look at the traffic throughout the path one other quick note is many of the devices will pull traffic from have resource constraints so firewalls load balancers switches these things have a primary job and it's not traffic
captured their primary job is usually to push traffic through so we want to be very specific and explicit about how we Define filters and how we create our packet we don't just want to grab everything we don't want to be greedy and there's a couple practical reasons for that so one of the Practical reasons is compliance if you work in an environment or you have a customer that is a sensitive environment if you're dealing with account numbers pii financial information perhaps PCI card data you don't want to have your analysis now be part of the compliance scope if it doesn't need to be there's no reason to grab customer data if that's not what you're interested in unless you're Danny
and you're just grabbing all the data for your big fat report but that's a different talk uh and then practically captures take up space so you know we're grabbing everything as it's seen across the wire there's not any compression in play here they get big quick and the bigger they are the more of a pain the butt it is to sift through them the slower the filters work the slower they load so some terminology that we'll encounter for the purposes of this talk a tap is a hardware device which will provide access to the data flowing across the network tap gets thrown around a lot as a method but for the purposes of today's Hardware
device uh span monitor mirror does anybody know the difference between those you do that's impressive because yeah vendor exactly there really isn't a difference right so these terms are interchangeable I'm going to use them interchangeably forgive me it's different vendors call it the same thing and they have different Technologies it is important to know when we're talking about switches and routers a lot of the vendors particularly Cisco don't play nice with the other vendors and so as we're grabbing packets it is sort of specific to each vendor the the technique we're going to use um so pcap the basic definition of a pcap it's actually a library and it's a library that runs in the IP stack that
allows us to reach in and grab traffic it's an API so it's also a file output but we'll talk about that in a minute and then a trace file Microsoft decided that they wanted their own lingo and so they refer to their packet captures as traces we'll talk about that but they use the event tracing for Windows framework to grab traffic the advantage of that is it doesn't require a pcapp driver and we'll dive a little deeper into that in a minute so next file types the file types you're most likely to encounter uh dot cap is the old netmon format uh pcap is what we see by default on a lot of packet capture tools other times if there's a
pack of capture baked into a smaller operating system like pan Os or iOS it's going to dump to pcap format pcapp NG is a new Wireshark format and that supports tighter time definitions in multiple sources and Dot ETL is event Trace log and that's Microsoft going off and doing their own thing which always works out for them right Windows phone yeah the zoom's great right can we have them the museum somewhere okay so this might seem a little obvious but one of the things if you're getting started with traffic analysis uh one of the things we like to talk about is a an adapter to use there's some really practical constraints around what adapter you want to use you certainly
can use a wireless adapter but oftentimes we want to play in The Copper world and if we're going to play in the copper world let's use gigabit adapters so we have the ability to get the appropriate amount of speed and let's use a bus that can actually support a gigabit adapter what's the problem with the gigabit adapter on usb2 yeah 480 megabits per second right so if it's a busy Network that's going to be a legitimate problem so if you go to the Apple store and buy their little USB network adapter you know you paid 30 bucks and it's 100 Megs that you're locked to with that thing so these are just two examples there's lots of great
Hardware out there Thunderbolts nice if you have the Apple platform it's a 10 gig back-end and the driver's pretty solid built in the OS it's also pretty cheap I like to use a dedicated adapter for packet captures and I'll talk about that a little bit more on the next slide but we want to kind of segregate ourselves from the traffic that's on our box we don't necessarily need Dropbox requests going out in the middle of our packet capture um on the non-osx site or the non Thunderbolt side this startac adapter is one of several great models this particular one has drivers for Linux for OS X for every flavor of windows it's USB 3 and it also has a USB 3 port on it
so if you're using something you know like an air which hopefully I didn't just interrupt my connection okay hold music here yeah all right okay so if we're using you know a netbook or an air or even a tablet whatever something with USB 3 it's very helpful and we can you know with USB 3 we can stack multiples right we can have a bunch of different adapters in a bunch of different places and they're cheap foreign here we want to listen we don't want to talk we don't want to be throwing traffic out on the network unless we're trying to analyze what our Box is doing in a given situation we don't want to have it just
throwing traffic all over the place and if you've ever just booted up Wireshark and hit listen not even connected to a network operating systems they're so noisy it's broadcast all over the place and if you have sync Services you know box.com Dropbox uh you know God help you if you're using any Apple services with bonjour broadcasting all over the place it's like a drunk guy to play so throw up the adapter turn off the protocols so we kill all the protocols and now we're just going to listen creates a much more sanitized pcap now if you were some sort of cave person you could use these um super smexy Hub act I smexy is a word
and I don't care who says otherwise um they're nice because they're they're abundant right you know the back of a network closet somewhere somebody has one of these things the one scenario that I will disclaim where a hub can be very helpful is if you need one source in a lot of destinations because a hub is a layer one device it's a repeater right it's like you're really gossipy co-worker everything it hears just blabs back out so to every single port without discretion so if you have multiple uh multiple destinations for your packet capture and only one source switches don't always like that as much where hubs have no problem with that at all below that we have the throwing star
land tap uh the gentleman out front looked like he was selling the slightly more polished version of this these are okay it's a fun project for soldering the problem that I've had with them is they're asymmetric so you patch them in and they're only going to give you either receive or transmit depending on how you patch them in and both of these devices are going to drop us down to 100 mag so another key Point um you know if you introduce a hub into your network uh collisions are stupid we don't need to introduce collisions it's if this is all you have for a lab environment it's fine but realistically if you're going to do a lot of pcap
scenarios I would recommend looking at an inexpensive switch so here are just two options every vendor has something that plays in this space the thing you want to double check is whether or not it supports a monitor mode or a span in the case of Cisco and you want to check what the constraints around that are so these devices are about 90 bucks each they're little gig switches these particular devices uh will both boot off of Poe which can be helpful if you're in an environment where you can't get power it's very easy to extend power with Poe and um they're they're cheap they're easy to program uh word of caution don't ever plug a switch into a production
environment that you're not intimately familiar with spanning tree does not like that Network admins do not like that so just make sure you have permission and know what you're doing when you plug in a foreign switch okay so now the meat of what we're going to talk about today so for the purposes today you are the resident packet Ninja at a company that's not real but we're going to explore a corporate Network we're going to walk through topology and we're going to talk about how to get packets from a variety of different places on that Network your goal is to identify the problem as it's laid out in front of you and find the packets and solve the
problem using your packet fool so we're going to go through four different scenarios here is our topology we've got three branch offices a corporate Network and kind of a headquarters and connected up to the Internet so first scenario the boss is angry what else is new right so today he's angry because the internal web application flows to a crawl every day at 1201 pm the server team is blaming the network that's never happened right server team has never gone I don't know it's gonna be the network service fine ass manager says it's great I don't know your brothers um so our web server is a Linux box and it's running locally in our data center
and this is an internal application we're looking at internal job so here's our strategy we're going to SSH into the web server we're going to capture traffic over the lunch hour when the slowdown's happening and we're going to use TCP down now key Point here we're going to set it up to record 50 Megs of data in five files our capture is going to run continuously and override itself so ring buffer is everybody familiar with the idea of a ring buffer it's going to keep overriding yourself yes no is that a vacant stair of acknowledgment I'm not sure all right Steve so our point is we're we're going to do what we can to not flood the disk and
tip over the server that's bad etiquette so we SSH into the server we throw TCP doing business legible at all can you guys kind of see what switches are there all right good yeah thank you guys seven feet away all right so TCP dumps very helpful uh included on just about every posix system and it's going to use the native lib pcap libraries that are on the Linux system so we're not installing any software and that's a key point of working in a production environment so we're going to specify our interface uh attack Big C is going to specify the file size in millions of bytes so roughly 10 Megs 10 million bytes attack little s is going to specify the snap
length of zero now the snap length is a parameter that says how much of the data to grab out of the packet most new versions of TCP dump will grab the whole packet by default older versions would not um they would stop up at like 65 000 bytes or something and so the you need to specify this on old versions new versions you can largely ignore it so if you've never seen this switch you're not using it it's probably not a big deal I include it here is just a failsafe if you work on an older system specify Tac s0 it'll just make sure you get everything that you're trying to capture so tack Little W is our file name intact
bib W is the number of files we're going to create so what we're doing we're going to create a capture interface ethernet 0 we're going to let it create five different files and it's just going to roll through those files as that data comes in so we're going to always have sort of the last 50 Megs of files broken out and I broke it out into separate files because it makes it more digestible for analysis that way wireshark's not struggle in the way loading up huge files so we ran our TCP dump and here's where we have five different files now if you guys notice the the first file is the smallest one so that's kind of where we
dropped off on a ring buffer when I stopped this it was on that top file next key step when we're doing analysis and production environment we're not going to dig through the traffic on the production box we're going to pull it off and do an offline box and do analysis there historically Wireshark has had some vulnerabilities parsing data so we don't want to just install Wireshark and whatever box we're interested in and start ripping through traffic we could potentially be introducing stabilities problems and vulnerability issues so taking a look at our traffic basically what we did here is in Wireshark we click statistics conversations ipv4 and we have a list of all the conversations the one across the
top you can see this guy right here he's by far the largest conversation so one particular host is beating up on this now if this was a huge production app we'd probably see a lot more traffic but this is a huge production app in my lab so we're really just seeing one box meet up on this guy so what we're going to do is create a quick filter and we're going to look at that traffic from that strange host so we identify our host here.25 is our server.167 is our host that's beating up on the server so our next slide ip.source equals equals and then we specify that client that's beating up on our host and we see tons and tons of git
requests um in our get request we see some strange parameters one of the parameters says it's seeking the Etsy password file now generally speaking that's not a normal web request unless you're Danny and it's usually dot dot slash dot dot slash dot dot yeah so that's an abnormal request and we're seeing it from an inside address to our inside server so we really want to figure out who who mr167 is let's go talk to him let's see what they're doing okay now we have a unique opportunity here because the source address is on the same subnet so we're not going to have to do a lot of digging to figure out who this client is
because the source is on the same subnet we can simply look inside Wireshark and see the MAC address and know that that's the MAC address of our host more than likely unless they're spoofing it which is possible but not terribly likely so what Mac address would we see if this was a host on a different subnet router exactly yeah we'd see our router and then we'd be investigating our router and that's not that interesting so looking at the MAC address that we've identified here we jump into our managed switch look at the MAC address table do a quick show Mac address table pipe it into include and that shows us what party's plugged into so after looking at the switch we find
an experienced auditor and he's running some web app scans over the lunch hour so we promise not to cut a corner off a cissp and he promised not to scan stuff during production hours without checking first so we probably could have seen this Behavior via the logs but one thing that's important here is we now have evidence of this Behavior so if it ever goes further or if it was a hostile party we've got evidence of this situation that we can put directly in an incident report more importantly we demonstrated how to grab our traffic off our production system without adversely affecting production on to scenario too so I have to see oh you know this text
down here is still too small this says my wife says her uh her development team looks exactly like this picture except they have e-cigs so developers have a look so in this scenario the dev team is setting up an ldap connection to an active directory domain controller sound familiar to anybody anybody ever gone through that um they insist everything's correct but they're all that query just won't work and so the domain controllers production box and in this environment we're not allowed to install any software without going through a Change Control meeting and we'd rather stand in front of a bus during traffic so what we're going to do we're going to use some built-in Windows tools to
capture the traffic we're going to export that into a format that Wireshark can read and we're going to digest it that way so the built-in tool we're going to use is United States Trace and we're going to capture some packets on the domain controller copy the trace file box over to our analysis box and use Microsoft message analyzer which has the acronym MMA it's the toughest protocol analyzer out there and we're going to use that to convert the the traffic into a format that Wireshark will understand once we have the packets we're going to look at the ldap requests and see what's going on um brief intermission uh moment to silence that bond is dead
so anybody use netmon back in the day yeah a couple hands a couple guys that are older than 20. um you know back back in the early days of Packard back at capture when it was ethereal not Wireshark netmon was your tool that you could install on Windows and it installed its own driver Library so this is before the driver library was baked in with the event tracing for Windows architecture in event tracing for Windows the ETL libraries this is built into 2008 R2 Server 2012 Server 2012 R2 windows 7881 I imagine 10 will include it as well 32 and 64-bit so we have this packet capture tool on all modern versions of Windows very
important to know at least how to use it so Microsoft message analyzer is Microsoft's netmon replacement we don't need Microsoft message analyzer to capture traffic we just need it to view the ETL files so I'm not going to go through this tracing architecture in depth this slides in here if you'd like to see how Microsoft leverages the stack what you need to know essentially is that we used to do packet captures on windows with the wind pcapp library and you'd have to install that and that could potentially be service affecting because you were modifying the network stack of a box while it was up and running now it's baked in so we have this Neti stage
Trace command that we can utilize without affecting production United States Trace outputs in the event Trace log or ETL format so here we show using it um it's not a huge change but you do need admin access because you are working pretty low in the protocol stack and one key point so I'm going to kick off this United States Trace here and you'll notice it just returns me to a command prompt so very important to specify file mode equals circular because if you kick this off and you just go back to lunch and forget all about it you will fill up the drive it doesn't sit there and show you what's actively running it's not TCP dump with
output or anything like that it just drops you back to a prompt and assumes all well so for this particular capture we say capture yes file mode circular we're going to specify our maximum size at 100 Megs grab a little bit more traffic than before and we're specifying our Trace file once again if that dot ETL format so while it's running if you want to see what it's doing you can do this netsh Trace show status and that'll kind of dump and tell you what it's doing but otherwise if you don't do that it just runs in the background you don't see anything it doesn't give you any feedback when you're all set you know after the
development team has made their requests we can say United States Trace stop that'll stop the running capture and we got a file so we stopped capture we see two files we have a cab file cabinet file and a DOT ETL the ETL being the big one so next step we're on a production system we're going to take our capture we're going to pull it off the production system we're going to a Windows box and it pains me to say this but you're gonna have to use the windows box or a VM for at least this step because Microsoft message analyzer is a windows program it's not ported over a format for the platforms so here is our capture inside of MMA
Microsoft message analyzer honestly we could start digging into our ldap traffic here we could look and go through and find our ldap requests but there's a couple constraints here one uh quick sidebar has anybody worked with Microsoft message analyzer showing one okay Nate yeah anybody else okay that's kind of the response that I found from folks uh I'm curious and by all means reach out if you do work with us in the future I found it to be just slow as crap I mean I there's just no other way to say it it just it was so painfully slow to interact with Nate was that your experience as well yeah yeah so it was it was painfully
slow um and then it is single platform it is you know the windows architecture and I don't primarily work in the windows space so I wanted to get in there and out of there as quickly as possible like a dress shop I don't even want to be there um and the format's not convenient to share right so if you're sending this to an engineer on the other end of the phone helping your support issue he's not going to say please send me your Trace ETL file he's gonna say no send me a pcap so we need to know how to export this uh and most importantly I really have no idea how to use it I don't know
how the filters work I don't know how to sort stuff in here so we're going to get out of this program as quickly as possible file save as export uh and this is where netmon comes back in we have the netmod format capability so we can export from MMA right into a DOT cap format and then from there we can open up dot cap rate and Wireshark and now we see our traffic so we see an ldap response from the server on the devbox indicating a bind error usually an authentication problem so we can share that result we can show what the bind request looks like to the server with the dev team the modify that
program and then l.bine success so what is the point of this we could have used Windows event logs and said hey failed ldap you know maybe check your creds whatever but really we were able to correlate the request and they can see how the request is arriving and what it looks like to the server but most importantly we showed you how to grab packets from a Windows box without installing anything all these tools are baked in scenario number three the security team so security team is evaluating a new IPS and they want you to help them get traffic um has anybody here been through an IPS demo couple people so for those of you that
haven't yet Jason one or two um when you demo an IPS it's generally considered bad form to walk up to your network Edge and rip out the Upstream link and plug it into a box that you don't know how it works we usually don't do that all the packets fall over the floor it's a big mess um so when we're demoing a device like this usually what we want to do is we want to create a mirror port and take all that traffic and let it do its thing and run out the door and then we're going to mirror it over to something else and shoot it over to that box so we can kind
of play with the Box offline and not Jack up our Network so here's our strategy first thing we're going to do is we're going to look at our topology understand what our topology is and then look at the capabilities of the edge switch because that's going to limit what we can and cannot span once we've configured our Port we'll plug in we use Wireshark and we'll validate that we're seeing the correct traffic so I know you guys memorized that first topology diagram and you don't need to look at it again but just in case here it is again um I don't need your nonsense
so this is our corporate office and uh we are summarizing we have three different subnets here we have a server Network a DMZ and a Wan and we're aggregating and going on our Edge switch so 35 7 sorry 3750 stack at our Edge so what we're going to want to do is the server team requested to see the server traffic so we are going to span the Uplink on the server port so in the Cisco world we call uh Port mirroring spanning switch Port analyzer that's their term and it is relatively specific to their world so different makes and models of switches have different capabilities the biggest difference we see is how many simultaneous sessions can you do at the
same time and what can you use as a source sometimes you can use a whole VLAN as a source sometimes you can use multiple ports as a source say give me these five ports and shove it out this other Port over here the one problem we run into when we see that that method is it's very easy to over subscribe so if you span 20 ports out a single exit Port your rate limit is going to be whatever that single exit Port is so something to keep in mind as we're doing this so in this instance we have a 3750 and that's going to support two simultaneous span sessions and it's going to be able
to take uh ports a multitude of ports and a VLAN as a source so the first thing we're going to do logging into the switch is a show monitor session all that just tells us if there's anything running it would be considered bad form to log into the switch and clear all the monitor sessions right out of the gate if they're already looking at something so then we're going to Define our source port and Define our destination Port so the commands are pretty straightforward uh right here so monitor Session One Source so your sessions it's going to be one or two on this particular switch because that's our limit and then we're sourcing an interface and then we're
saying session one destination and then that's where we're going to plug Wireshark into is our destination interface that's it that's all there is to it from there we can do a show monitor session all and that tells us what's going on if we had multiple sessions that would show us the details of each in this instance we just have Session One so now we can see our active session and now we're going to plug into Port 12 our destination port and validate that we're getting traffic so now we've got some some packets we've plugged into gig 1012 we're all good we tell security team Hey guys you're ready to go let's copy the traffic over to you
and they can plug in their IPs and start analyzing the traffic now again this is duplicating another Port so realistically it's a copy of everything so for a security Appliance it'll alert that's about it for the most part with a couple exceptions so security teams happy but they review the topology and realized they missed a couple networks um so they'd like to see everything so let's talk about what looks like to span an entire trunk board so in this instance we look at the config of our trunk Port it's pretty straightforward we just have encapsulation.1q we're not pruning vlance all the vlans are allowed to cross and we say switch Port mode trunk so to get identical behavior on our span
Port our destination Port is going to be configured as a trunk as well so we say switch Port trunk encapsulation.1 Cube and switch Port mode Trump and what that's going to do for us is as we send packets over to that it's going to keep the VLAN tags intact and so we'll be able to see which traffic came from which we land so we'll create our monitor session and we send it out our new trunk Port plug the laptop into g1012 again and capture some packets so on our previous slide our encapsulation right here was native which means no tags here we see dot 1q so the traffic is egressing that port with frame tag still intact that means
if you're getting traffic from five different vlans you're going to have five different tags you'll be able to sort through that traffic in Wireshark and see those frame tags and that's very helpful in a big complex environment it's extremely helpful if you're in an environment where the network folks maybe don't have a deep understanding of what traffic is on what VLAN and you're trying to sort it out for them so here's our trunk traffic we see IP addresses from our three different networks and most importantly we see our tags specified so right here tag id99 so the VLAN text is coming through which is fantastic unless you're running Windows so here's the same packet capture with
and without tags and essentially what happens is that we see this 8021q Frame option this just disappears in the capture as we're looking at Wireshark there's not an error or anything it's just not there and so we look at it try and figure out okay what is going on why are we not seeing that at all um there's a couple different explanations for that one if we have native down here specified well what we're telling the switch is strip all the tags off before you dump it out the port so that's a booboo on our monitor session statement so that's easy to fix or Windows hates tags um so there's a couple issues with the
Windows driver stack and you can modify the registry there's a link in here from Intel I don't know if this works with every driver or not but we were able to with some Intel ethernet drivers make a couple registry changes and then we would start to see the tags come through so if you're doing any packet analysis and you guys need to see frame tags um this is good to know on the Windows side using uh Centos Ubuntu Red Hat OS X everything just came through we saw the text just fine so I don't know why Windows strips the tags in the driver stack but they do foreign to our scenario the security team still
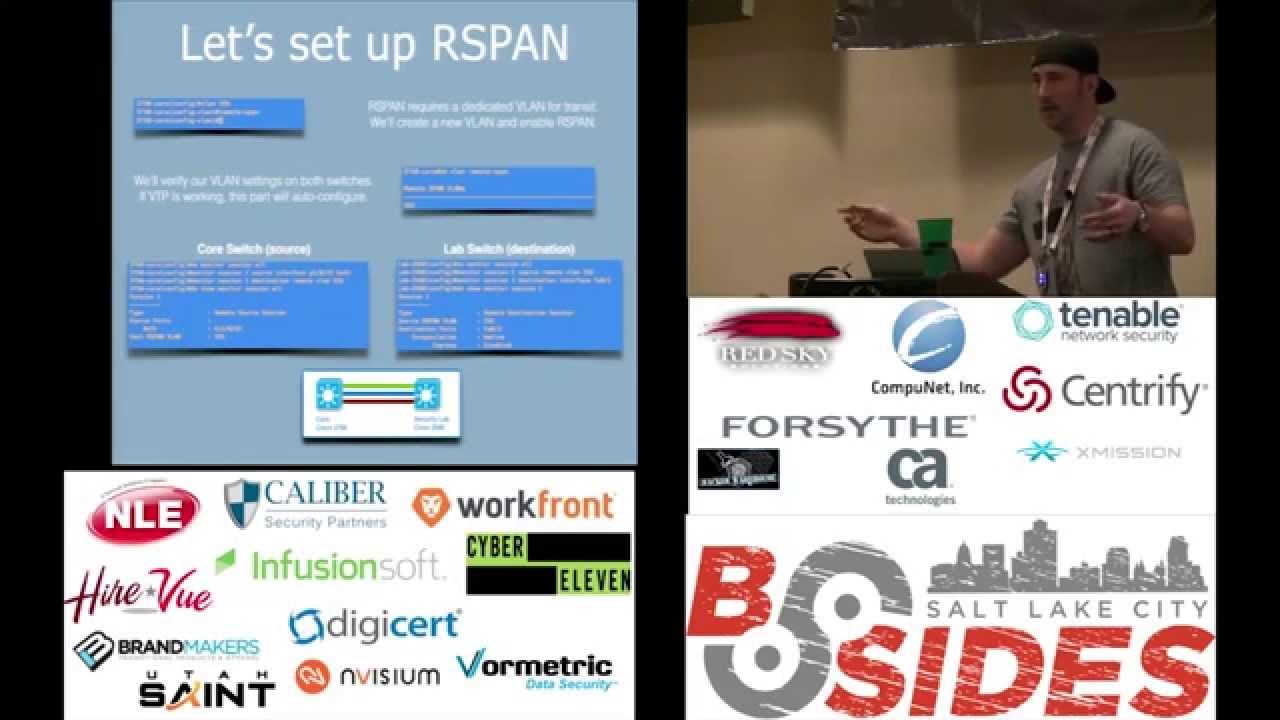
tweaking their hardware and they don't want to plug their IPs into the edge they want to plug their IPs into a switch in their lab and it's on a different floor it's a different switch and they still want all the traffic so how do we get the traffic from The Edge back over to their lab we use rspan so our span is remote spanning and basically what we're going to do is mirror Port but on a different switch so HP brocade Juniper and probably every other big man switch vendor will support this the most of those vendors refer to it as nearing and remote mirroring key points our span is not compatible with remote mirroring and if you have a
Cisco switch a juniper switch and a Cisco switch it won't work correctly these things usually are so the way this works is we're going to define a VLAN for our Network and the VLAN is the transit for the remote span and that's why that we're dependent across the same environment all the way through so we Define the VLAN here tell it to shoot all the traffic up to the VLAN the switch is used there natural ability to pass vlans to another and then this switch knows how to pull the traffic off that VLAN foreign so let's look at the configuration very very similar to the monitor session configuration the difference is we're going to do everything times two because
we're going to configure the source and then the destination on each switch so the first thing we're going to do is create a VLAN um and then when you create this VLAN this is just your r-span Transit VLAN so it's not something you're using for anything else don't use the printer VLAN that's a bad day um so we create the VLAN and now we're going to say remote span letting Cisco know that our intention is to use this as a remote span VLAN if you don't specify it as a remote span VLAN on every switch it won't work correctly so once we specify that we have our rspan VLAN we can do show VLAN and see
that it's populated and it's ready to use if you have vtp or virtual trunk protocol that will pass through automatically a lot of folks don't like to use vtp so you'll have to manually configure it on both sides in that case so our source we're going to specify the source interface and then we're going to use the destination as VLAN 555 so we're seeing that here the left side right here remote VLAN 555. so show monitor session all and we see and this is our source switch we see take it from that port and dump it to that VLAN now on our lab switch which is our destination we're going to see say the source is a remote VLAN and
the destination is a local port so over here Source out of VLAN 555 and then dump out the ethernet port
and here is our results we see all three networks and that comes over from our lab switch now in this instance we don't see frame text you guys know why we don't see frame tags they're stripped off once upon the remote view line it's excellent so we cannot get free frame tags through in our span it's the limitation of how the traffic travels the network so the first switch tags it all 555 shoots it across the network and then that remote switch strips all those tags out so in this instance great we can shoot all the traffic over to another switch but you no longer have tags in that so scenario three what we've shown is we
duplicated traffic on our existing infrastructure we didn't make any topology changes we just mirrored some ports we used a spanstation when we were on the same switch and we use a remote span session we're on a distance switch scenario four the packet mop sometimes we drop traffic and sometimes we want to know what that traffic was so let's take a look at how to analyze drop traffic so in our scenario our company restricts outbound DNS so only our DNS servers are allowed not terribly uncommon um lately we noticed that we're seeing a ton of packet drops and it's a bunch of DNS requests and they're circumventing our DNS servers it's clients reaching out for DNS and they're circumventing
our infrastructure so to try and figure out what's causing this Spike we want to look at that DNS traffic that drop traffic after our firewall's already dropped it we don't want to allow it and then look at it we want to continue to drop it but take a look and see what's going on so in this instance we're going to use Apollo Alto you could certainly use a Cisco ASA or if you absolutely had to probably afford a man I suppose maybe a juniper if you're strapped
that's just a jab a couple guys up front so all good Hardware they'll all do this just fine um this is specific to firewalls though uh when we're talking like ACLS and switches they don't generally have the capability to grab drop traffic so firewalls can grab traffic at the drop State though on the Palo Alto I'm just using a couple of CLI commands to initiate initiate the packet capture and it's just four commands I'm not going to go through them real deep uh Cisco is very similar so are the other vendors and I have a little cheat sheet at the end that will kind of go over that so we're going to start the packet
capture and again as we talked about before um these devices have resource constraints so we want to use a filter we're specifying a filter here and just saying you know show me the the DNS traffic that you're dropping we don't want to just grab all the traffic on our firewall so we're going to start our capture let it run for a little bit and stop the capture and download the file all this can be done through the GUI on the Apollo and the Cisco as well so after we've grabbed our drop traffic we can dig into it in Wireshark and pull it up and we can now see it's an internal host nice thing about DNS is
it's wide open right so we can see the DNS requests the DNS are trying to resolve malware.com and malware.com is not a real domain it's just one I created for this example but this behavior is real Behavior this you will see this if you have very strange DNS behavior um malware is an oftentimes a culprit so this helps us understand all right this is not legitimate traffic and we need to go look at those house they may be infected so drop traffic can be useful helps us dig deep into the network issues um and once again a well-defined filter is important we don't want to add too much overhead to the firewall we don't want that thing Kipping over
so to summarize what we showed you we showed you how to grab traffic using TCP dump on a Linux host how to use United States trace on a Windows host built in how to create a span and an R span again Fender agnostic there's mirroring and remote mirroring it's very similar and how to capture drop traffic on a firewall because there's a lot of CLI stuff in here we created a little cheat sheet and on my cheat sheet we have uh the Cisco span commands the rspan commands HP Port mirroring Juniper brocade Palo Alto Cisco ASA or the gate TCP dump F5 which is TCP job notice H trace and t-sharp if you guys think of any platforms where you'd
like to see how to setup captures your mirrors and it's not included on here uh reach out I got some white space to fill we'll update it and here are the download links I promised you for all the content so if you want go ahead download that uh are there any questions would anybody like another mimosa okay well there we go thanks guys
Related talks
 56:25
56:25 41:28
41:28 1:00:45
 53:47
53:47 55:42
55:42 52:16
52:16