Logs don't lie, even if most of them are lost in L7 DDoS

Show transcript [en]
[Music] foreign
[Music]
second b-sides and this time despite having a tool that I'll be doing the moderation part I also at some moment uh participated in call for papers and despite me having the most bizarre speaker's bio to check it from the website later uh I got selected so the talk is about something I'm doing uh at work and that I I have been doing touring also past five years when I was working at Zone so a lot of these things are kind of contribution of my current and previous uh work thanks to whom I understand these things and and I have learned these things uh logs don't lie even if part of them is lost we are in the theater basically
if it's a theater place so of course we need to start with a plot twist rocks namely extremely good at lying to you and especially not showing up when you need them it has happened to me a lot of times in my life but I've also during that learned how to kind of like massage the Rocks into being and turns out that while I actually like dealing with reading the logs and finding the bad guys and everything then actually most important part of my work for example when we were on lock Shields cyber exercise was actually making sure that all logs are in Pro performance and they reach elastic uh so some scene setting [Music]
what I'm going to talk is because I've been dealing with the side of security which could be web application security so I'll be looking on at the logs not from the side of Marlborough happening on your Windows computers but exactly things that are happening earlier in relation to web servers and somehow uh starting from the 24th of February there has been a more DDOS attacks than I've ever seen before so I'm using that as a case to case for that and then we are going into the logs themselves but to kind of like specify the territory there is this very famous Google interview question about what happens if you are typing the URL into the browser
so I went out and tried to find this is there some kind of explanation and turns out some Alex Gonzalez whatever has done 300 comments and come up with a very detailed thing in as much detail as possible when you go in and you're actually going to see that the part I'm going to talk is just this one line in this thing and even more I'm going to talk about the part that request ER is received by a web server then probably it is passed on to some application I really don't care how how the application works for me currently it is just something that takes time I don't go deep into that uh and then the responses can send back
again these parts as I said I don't care uh I'm just talking about basically this part and perhaps a bit about how it is going to get sent back but what people are doing with the response who cares it's DDOS they're probably not even reading what they are getting there so anyway uh what kind of uh denial of services I'm going to keep in mind uh when uh while describing the things I have been looking for in the logs uh three different examples the first one is something called a concerned customer who informs a website that they are giving error 500s or something like that this picture is actually when I check the logs later and actually
painted the number of requests and turns out that the user arrived at 4 33 started doing different kinds of loads looking for things and by 446 which is like 12 minutes later the user had the concerned visitor had found endpoint that very effectively took the site down and actually with very few requests so there wasn't a question I think the original one I've apparently cut away part of the numbers but I think it was thousands of requests and then as you see it's basically a TENS of her ecos was taking Tower again interesting to understand how it's happening because if some random dude can find out how to take your site with 10 requests then probably this is an
important issue the next case is actually this picture by the way the first picture was like something like tens of minutes so this is basically the Escape down there 5 10 cilities a seconds so this is one minute of a massive Adidas attack level seven so because these sites are behind cloudflare so we don't care about lower levels just what could come through interesting to see is actually the red line there is indication of error 500s and when you see the brown line is the cloud fairs defense kicking in so we can say that by the number perhaps a bit after 10th second of the attack it starts kind of like doing something and it actually gears up at a 30 second mark
so until that we are kind of naked we are not being protected and we need to deal with these things ourselves so the question is for me uh why did it start giving these error 500s and what do I need to make my ingresses and apps more resilient to these kinds of events third one is some person or person's trying out how the cloudflare works or how the site Works behind the cloudflare so the first hit was something like I think four million requests in one minute the second one was I think three or four minutes and uh and uh third one was also again one minute ten something like four million requests in this graph
okay and the time was like one hour in the night and uh 30 million requests total so Let's uh think now about this thing what is happening uh Behind these attacks and actually on the side of our server and let's look a bit more detail into what's actually happening and for me always the question is that okay I know what happened site went down but what actually caused that what was the bottleneck where I need to deal with things so we can imagine that the same HTTP request after somebody typed it in in the browser or launched in a DDOS tool either it's cloudflare from cloudflare it comes to some kind of our whatever kubernetes Ingress
uh or whatever is kind of like there uh sometimes it's just going to maybe some kind of load Challenger there is probably a varnish doing caching there's probably nginx serving Pages then there is something doing the PHP or whatever language processes uh distribution and then there is a process which again is going to talk to a lot of different things so what is exactly the thing that goes wrong unfortunately there are things that are repeating and there is always a lot of specific questions that can be with each of these uh we can see it is the cloud for trigger these English connections run out was the page actually cached somewhere because you I especially picked the
picture with uh blue and yellow lines because one of them was like and the page is served by cloudflare and another one was Pages search by origin and it was a static page so why the heck went half of the pages to our origin why we are not caching it where we could that uh there are questions with uh web server all of these proposable processes in fbm and actually CPU Cycles which is a thing which I working in a hosting company I was testing a lot and I found that one of the very easy explanations usually works very well so if serving one request takes like half a second 500 milliseconds and this is not database
time but mostly something happening in the whatever PHP our JavaScript wherever then if we have 10 cores then 10 cores can serve in one second 20 requests if we have one request a response taking two and a half seconds then well we can probably respond with uh for for respond to four requests per second uh when we are now thinking about the kind of the first data set deck then I accidentally did a similar thing a couple of days ago when there was a question from from one of teams that uh why some servers giving error 500s and I took the logs and uh going over I found that there was a SEO tool doing site scan SEO tools are
very bad for your sites because they are often visiting pages that are not cached because people don't go to all of the million Pages you have but it it shows very nicely what are the slow requests and I found that for some reason some specific and these are actually category Pages were taking uh very long I picked a specific category pages and started running just a curl to see how long it takes quarter time is just my my Alias that runs curl and outputs not what it received but just how long it took to do which is kind of nicer to do than in a browser and well I have also another command which is time Loop
so it's doing the same thing over and over and again so currently I think I opened five browser tabs started running this 30 second codes a 30 second requests with changing cache poster at the end just changing number to make sure it's not cached and I think in 10 minutes the developer was in slack asking that why are you interested in this product because all of the New Relic alerts had been went off that there is a lot of very slow requests reaching the site so basically and I think uh here is the picture so the blue blue area is one minute so I did I think it's uh 10 requests per minute and I was able to basically crash the
site with 10 requests per per minute I could probably variate more or the categories what I'm looking and everything because there is site map where I can get these but here it's uh very simple basically boom and the site is gone uh now the good part of this log is actually that it had at the end of the line also similar seconds the seconds don't match exactly because I'm taking them from kind of a slightly different part of the test but I can very easily understand what's going on there unfortunately when we are looking at your average wave access log then it turns out that it doesn't have that kind of data and it is very difficult to understand
what is the application actually doing while it's under stress because uh for me the indicator that it's just running long long time is uh um is indicator which helps me find but there are other mistakes in this particular line first the IP address because often the web requests comes through different parts parts for example it starts with a Cloud Player golfer comes to your loot balancer whatever Ingress there it goes to Varnish and so and so on and uh the web server usually or actually the one which is currently processing gets there gets the request from the previous guy so by default everything tends to be uh the previous guy's IP next question is the time
when you're looking at the time in nginx logs then what time you're actually seeing any idea it's a time of end of request so if you are trying to kind of like find a race condition which request came first and crashed the site then you are going to find my 30 second requests way after things happen well there is no milliseconds because and when we are talking about 4 million requests per minute then you need to couple of have a couple of decimals to think about that the duration and also what served that was it actually this uh application maybe it was a statical file and I should kind of like completely get rid of that uh from
the logs to make it more easily readable uh fortunately the the version I was using there was kubernetes Ingress nginx which has a default logging format I think unlike Engineers Ingress there is a completely different configurations engineering Ingress and Ingress nginx and I especially shout out to my colleagues who have named the Ingress engineics as nginx Ingress so when you are whenever I'm going to look for a configuration settings I'm kind of like just going crazy uh anyway it has cool things it actually tells it has correct IP address uh time okay it does have the time it took to serve time actually how it how long it took to talk to Upstream there is also a
specific IP of this Upstream service and then I know aha okay this one went to these guys and now I can start looking what they did there so providing more information is log files is something that when you are setting up the system uh which is better than the first time first thing because afterwards everybody forgets that uh uh there is a need to kind of like configure the server because server usually gets together like configured the first thing and nobody looks at that later this is now a bit uh wider View and uh while it is actually copied from Excel because I needed to get this data somewhere on one page this is actually from Google Cloud's
uh what's the stackdriver or whatever is there the logging logging system so the same requests I showed have actually three different types so we have the end of request processing time which uh thankfully is very informative I know when nothing when nothing stopped happening where everything stopped happening there is a time of receiving the log line and usually the first one is the time the lock was received in some kind of logging system it is very common when you're loading the logs into pushing them into elastic or wherever you are running them that they tend to have the time you are seeing is the time it was received and this is kind of like uh it
usually takes a bit of configuration or making sure the field is named timestamp or actually looks like a timestamp or something like that but uh yeah probably this time doesn't look automatically like that so we actually do need did we get three quests in which order they actually came in and then we can start off trying to see that what is the relation what why did things go the way they went because I think one of the very common problems when things start to snowball is that there is some kind of database lock something in the back end is happening or maybe the server is making some external request to somewhere and this kind of like uh request stall and uh
server eventually is dead this is actually how I like my locks this is my own lock configuration my default configuration for nginx if anybody ever wants that like you are welcome to I don't know find me on whatever Media or here ask me later I can I can show you that I have also on next next slide but I do have the request start time I have the request end time I have a request duration okay I could calculate having one time and duration I can calculate all that time but it's kind of like very convenient to have them so I can sort the request by start or end and if I see like for example that all of the
requests started ending at the same moment it means this moment is when the lock was released wherever and I I can confirm this was a lock related problem her remote address user if it's logged on remote Port the remote Port is also cool because when you're looking at all of the traffic coming from mobile operators who are doing that ip4 then probably the only way if they are locking how you can go to the police and find out the person who is behind that is if you are knowing the remote Port if they are logging it request length how much data was sent during the request this is a post request I'm showing here so I know ah
okay it's five kilobytes looking at the same application at some time I started seeing very long post requests so I knew there was a problem at the site which was sending data to this particular API for some reason the requests to grow growing so I needed to fix the front end two interesting things request URI and URI what's the difference one is the one which web server got and the other one is actually what script was executed as a result of that which again kind of often helps me understand what's going on arguments that are not there is a hosts oh and I have a couple of host names the host is actually the host header of the request
yeah you're saying it can be forged cool if I see it forged then this is interesting information for me so I need to probably look at these requests more and also actual hostname which is the server from the web server configuration so I know exactly which part of web server was serving that status points different content type again very cool to know what the server actually thinks it's sent back it's Json okay but if let's say if we are I don't know getting maybe accessing CSS and it outputs I don't know HTML it's a bit suspicious fbm1 did it use actual application so I can very easily sort out from the logs the lines that are running the code
because if it was not running the code probably it's not causing me DDOS problems it's not something that uh hackers are trying to I don't know abuse so very information Upstream response time which might be different from the request time because it takes time and also the difference between these two times uh shows me that uh okay if if they have closed it's not a problem but if they are very separate there is a question why does the response from the Upstream take so much but the full request is longer again when you're looking at the servers doing bad stuff during attacks there are moments when the two things get kind of like uh much separated
and they're also very cool and fakeable uh header x414 we have been coming back to that but I recall uh Ethan once uh mentioned that when you were looking at spectixes kind of access logs it was interesting to see that people snooping around were using some kind of vpns or proxies and this proxy is very nicely added the X forward in four headers so it was also actually visible but it what it was So currently it's actually interesting the main address is a z-scaler and then the four or the four addresses some from from South Africa that scalar is basically what it says zero trust provider they are describing themselves as a leading zero trust
whatever stuck in the world so basically as somebody is using their Network and accessing this site the configuration uh actually I'd like to see same thing also in the health charts of uh English engineers and the other one as well is calculating some specific values uh like uh I'm setting because it can be only set on the server level so it's like below I'm setting the start time you can actually in nginx record the start time of request if you are configuring a variable yourself so this will be the start and the final request time will be just the end of the request which is usually locked why I'm doing this safe numeric values well this is because I like to put the
numbers in Json as numbers not strings makes it easier for later to interpret turns out that it is very important whenever your configuring your log ingest to make sure everything gets proper data type for example we found out during lock Shields we wanted to make some filters for IP addresses and use consider notation not adding iprs is one by one to see what the red team is doing of course or maybe real users and turns out that if it's string it doesn't work it needs to be IP address so you need to make sure all of the formats are always correct and it's always again better to do these things at the very beginning of
your logging process and then get the real IP again my examples are from from my life where I'm behind Cloud fair so here is two things first I'm using Cloud for specific header I can be sure that it's a cloud fair is not letting to letting it be letting it be faked I've tried at least I couldn't maybe some some people can and only if it's coming from their IP addresses um to be sure that it's not spoofed and I can always uh trust that interestingly the IPR set of clover has changed over past years I think not not very often but there was a change there was a part of I think it was this 104 16 or something like that
where they took one's part which is currently used for Apple has for iCloud Pro users some private browsing solution which is using cloudflare Akamai and fastly networks to root the traffic so it's going there also Cloud first own zero trust I think is using the eyepiece from that range so it turns out that when you don't know that you can actually start thinking that okay how are the users coming from cloudflare or what's happening I told her doesn't provide their users of Ip of course in X4 or before uh funny part with that is whenever you are setting up web applications there is this chain of all of these participating points that all need to
get the first and correct IP address so my my configuration on that part is that when I get it in the Ingress I make sure it's Cloud for IP I make sure nobody else but go upload for a gun access this uh our Ingress and then I uh Uber ride the X forwarded four with this information that I know to be correct so there is no question because X forward E4 can contain multiply purchases and it's always the question did the programmer actually read the manual correctly and decide if they need to take the first or last one or maybe the middle one or I don't know put them all together so all of this path and uh
it's just uh I'm just kind of like starting from the in inside most thing let's say PHP setting my X4 or the four header and seeing if it comes the stupid number comes through if it comes it's bad if it's some internal IP it's bad so I kind of like go to set up to the end because there is always some smarter somewhere who has decided to implement whatever they found on stack Exchange so when you're looking from getting uh for instruction to creating client Type e in PHP you are probably arriving on this page which has actually for some reason this one isn't the topmost transfer there is a lot more wrong on answers before you
come to that for unknown reasons maybe it's so down because it's a security problem so say they are having those comments which uh so those answers which don't explicitly say they are security problems up there editors note and comment this is bad thing but yeah somebody always does that so you have kind of like passed everything through they are going to find from somewhere from some rare header the wrong information and using it because it's so cool client type views also uh let's now look at the things uh once more from the uh so what was actually behind this picture that I was able to understand thanks to just looking at the count of requests
uh this was a nice MP4 video sent to customer our cover customer by a concerned citizen who demonstrated that they found a login page and opening process inspector there is a request and then they are going with that to copying the things and going with these into something called open bullet which probably is a good tool for you to test your own servers in the same manner and I said okay I understand okay you're doing a login for end times uh the hashing of the password probably takes time it's okay it's it's easy to crush the server and then I watched uh why does it say error 400 not something like uh bad password or or
whatever no not matching and then I found that huh script kid he didn't notice that the original uh question had a content type of application Json this one had uh form encoded so there's some kind of a middleware API decided that okay I'm not going to do anything and despite being the API doing some decision on the most Elementary part of just making sure that okay this doesn't look like a Json request that's not serve that he was able to take that down uh there was a wrong content type I think it was related to the question that just somehow the node.js backend died again because I've seen a lot of cases where people don't understand that they know no
chairs application when you launch it it's basically a single thread or let's say thing single worker you need to kind of like make sure there is more of them doing the work so probably that's what uh died there uh alternative font scenario which I've seen for multiple times is more from requests so forward it to whatever is behind the API elastic which gets an error which is not caught promises are not fulfilled and system dies very cool that's now the second DDOS mitigation it started with a request set like that it quickly went up into trying to provide changing URL and bypassing caching interestingly this is wrong query parameter they didn't check what's the correct query in this system so it
didn't actually try to run unique queries for everything it still crashed because there was just so much of them and the interesting part is that the kind of starting of the cloudflare cloudflare has very good level 70 dos rules there is basically signature number 15 which I think is that it has a strange looking user agents but the most probable one is that the origin is we're going to give errors so basically Cloud first level seven DDOS protection very much depends on your server dying so basically if you feel it's too much start giving error 500 Cloud for takes over just make sure you kind of like stop giving 500 later uh so this one was
again four million requests I think the one minute and four million requests kind of like seems to be a repeating pattern here something like 4000 IP addresses doing somewhat more than thousand requests but it's uh not that much and unfortunately most of the rate limiting is very stupid you can rate limit requests per IP and if they are doing thousand requests to basically the same uh URL then it's uh just uh for them it's just a thousand requests which is completely different than actual user traffic which is usually requesting different files different AP endpoints and so on and we also learned that recovery took a way uh longer why did it take longer because uh
all of these paths somewhere it was stuck there was probably some problems with Ingress there was probably some PHP adapter application back there which was struggling it probably had overloaded the SQL database and whatever so until all of these queues kind of like empty themselves the site was down so one minute tdos even if the protections click kick in at uh second 30. then recovery from that might be actually maybe five minutes maybe eight minutes or something like that depending how well you have looked what actually is happening back there so that's the point where I went away from looking at the at the access logs and I started actually correlating the times to the logs I have about the different
server components performance again that's why it's very important to have correct times because otherwise I can't correlate these things if it's kind of like lock has lines which are telling that when everything ended then how can I find the start of the attack uh which comes brings us me to the last example which is the detection has left the house uh it happened uh some time ago the official answer came later to me was that oops Yeah we had some kind of uh problem with false positives or false negatives in rule number whatever 15. uh I don't know how they didn't notice that the server is giving error 500 also but anyway somehow it happened and for me it
also happened to be a very inconvenient case because it wasn't our Enterprise Cloud for it was client's own uh cloudflare Pro which is a very cool service but I can't get the gold Cloud for rocks and I'm actually kind of like I totally like that even if they let the Adidas protect Adidas is through and whatever mistakes that happen we are still friends because I can get super quality Json formatted logs that have start time with milliseconds and time with milliseconds what happened everything and I can just sit and take all of the four million requests and then start uh painfully going through them and seeing what actually happened uh this time I didn't have so what I had
to do was I had to resolve to whatever the actual web servers had provided to me and it turned out that the yellow is the normal traffic and the peak is then uh what they were able to take until they went down so I think there is currently capacity I don't know by I maybe 15 20 times so I think kind of like for normal use everything is okay but of the 4 million requests I think I saw in uh in my side logs I think it was 58 000 or something like that it was 1.6 percent of the logs that I actually was able to get and uh started to work and uh draw the
duration of that Tech and uh whatever happened and then I noticed that actually leave my locks were with error 499 uh which means that the client has left the house uh basically the Adidas serves very nicely made the requests and didn't bother to wait until the end for my side all of this long chain or whole of the requests was booted up the application started working and the guy said okay I'm going to do something next so I had full of the request log of these things I also found that okay there was a fake IP addresses which turned out uh multi-car statuses and something like that uh I found out that the default Ingress configuration is trying to reach
the back end three times so basically our own Ingress was increasing the load on application which was already down and instead of just saying error by 500 no guys go home no nothing to see here it just kept can I get something can I get something so uh and I also found that the log is very cool because the log at some point has one IP address and at some some point has at the same time the three IP address is separated by commas uh it's very difficult to parse that uh I also found the numbers went went back and because I didn't have any any real IP addresses I started looking what what fun I can do with uh fake IP
addresses and I found that this particular botnet is just generating addresses with all four uh parts of ip4 address starting from 100 to 255. so again interesting piece of information uh to uh to use that is also interesting that some of the IP ranges are not spoofed I'm not sure why and then I went actually to look how things are happening in the in the uh container land and I found that yes in 50 seconds after start of the attack we detected that the hell aliveness has gone it's basically at the end of the attack it wanted to ask the server to go down nicely the server was busy dying it didn't listen so it took like totally five
minutes to get to the point when uh it finally said okay container go out start new one so uh yeah that was uh the story and oh and I actually tried because of the worker connections uh uh got full uh on the second 23 of the attack when it was just ramping up so when you are whenever you are seeing uh anything happening do you try to get all of the data and which is available from that side and then go back to all of the steps and see what kind of information you can get from there for me I currently have these things in a memos so next time this happens to me I can
easily copy the strings of the messages from here and just see the same things in the uh logs very easily thank you
we have like one minute for questions considering there is also a price for that then it's possible that you're going to get the price if you ask now
oh question this ah there's a question there maybe you can run the mic wait for a mic thanks dito dito's are usually result of uh asynchronous effort you need to provide more effort than an attacker does looking at that and looking at what you've learned in the in the last couple of years how would you design a new environment to be as resilient as possible oh it's uh I have been always thinking that I need to build smart protections on my side so I one thing I want to do which Cloud for currently doesn't let me do is to be able to detect if there will be the number a number of requests with exactly
the same path is rising uh faster than expected so you can do the rate limiting by default It Is by IP but with nginx you can actually specify what you are using for a string and being able to modify that and decide when exactly you are going to just throw error 500s is something I've been trying to do for uh for a long time and and also using more security to to do that if that's available or then just Engineers own rate limiting so I can just throw my hands up and say oh header 500 Cloud Fair please save me and hopefully in 30 seconds the ignite Plover and the White Horse or whatever arrives
thanks we need some competition for the best question maybe one more
anything
well then yeah then the the only question is also the winning question and you can later pick a correctly sized uh uh hoodie or the voucher for twenty dollars in starch press Bookshop from the back of the stage thank you thank you to Peters
Related talks
 52:44
52:44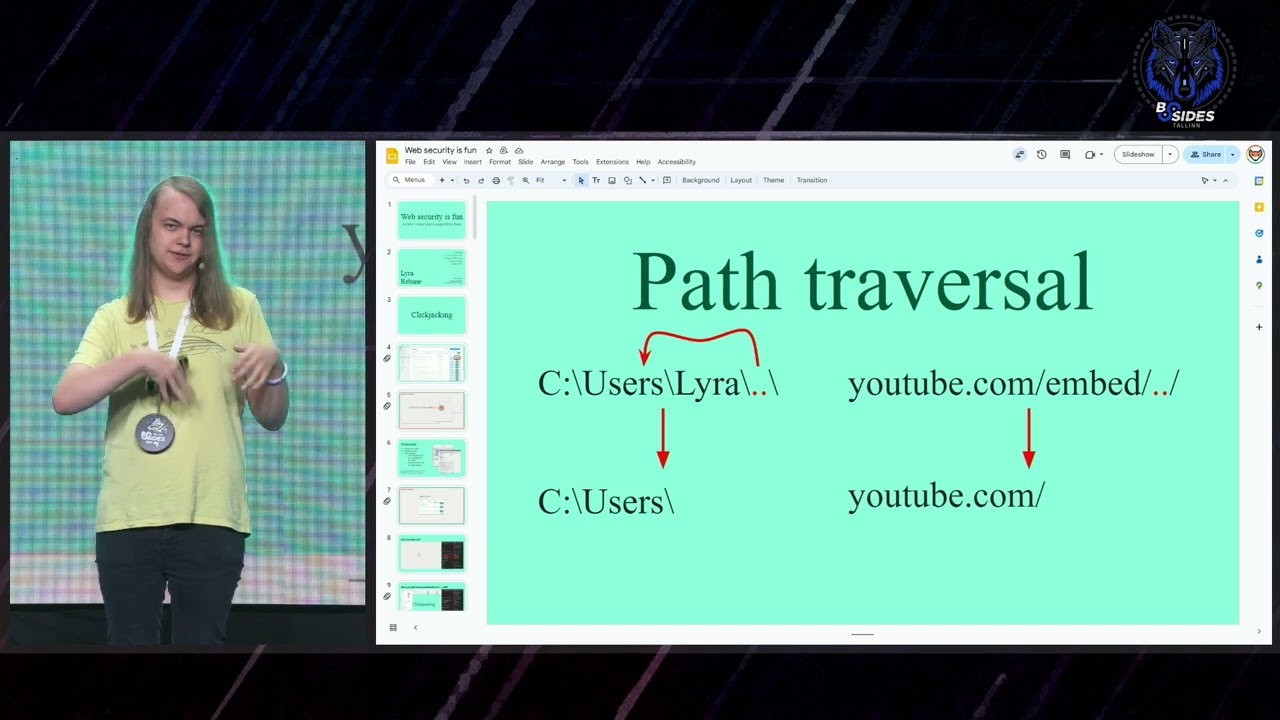 30:26
30:26 39:37
39:37 1:03:25
 50:28
50:28 48:27
48:27