Tales from the DevSecOps world: SIEM completely as Code
Show transcript [en]
hello people i'm gender rocky security engineer at scrooge in this presentation we're gonna talk about provisioning a cm with com and about the whole thing with our infrastructure is called trend and the workloads it suggests sometimes the securities basically to introduce the concept of cm is the thing that might inform us if we're getting hacked and consists of four basic components first of all the search engine that stores and searches the logs and generally does the heavy lifting the various data shippers and the other collectors that deliver the logs to the system an engine that does log correlations depending on specific rules exceptions and finally a system that alerts us on successful correlations in various ways like emails or slack
or whatever at scrooge we use an elastic sim with kibana elastic agents and that's a kind of stuff our data sources vary from aws to openlda so it contains all kinds of things finally we use a very small project priacl which has alerts and command triggers so here we play a c completely from scratch but in our brains at scrooge we use kubernetes with a pretty standard open source setup like nginx asset manager where with let's certificates external dns generally that kind of stuff generally we use heavily tested stuff that work well both on premise and on cloud so to deploy the sim we use an open source project called blue bar created a while ago by calligram
the repository consists of teraform modules and examples that deploy elasticsearch kibana and the rest using help the project is inspired from redbarn another terraform level for offensive cloud infrastructure such as c2 systems early directors bailout servers and such and it works on all kinds of branded clusters like from minicube to cloud miner services anything goes this is how the empty bed where everything will get blown looks like and this is uh how the complete picture looks like and the deployed services that get there so all these services get a tls enabled endpoint for us to reach and consume and also they their interconnections between them are all tier less enabled finally this way we end up with a default cm
deployment that has a learning command triggering dashboards and exotic load connection so now george will explain to you how to configure the elastic stack as code hi this is george i'm a security engineer at scrooge and we're gonna talk about configuring the elastic stack as code logs logs are important they are generated by services and applications these logs provide information for what is happening right now and this kind of information needs to be transformed to provide a value to us or an administrator bits and fluency data shippers and data collectors are used to gather and push this logs these sets of data are simple elastic indices or indexes an index has a structure predefined by
an index template and the incoming data are enforced much destruction the incoming data might need some transformations and this is achieved by ingest pipelines in steps using processors a processor might be a simple addition of a field or a deletion or a modification or a calculator our indexes can include data retention policies in defined phases the faces are hot warm cold and then delicious finally snapshots are taken regularly as daily backups and all of these components of course can be configured from kibana but it has to be done every time a new setup is deployed so we create a structured portable and auditable way to maintain these configurations as code and do it only once
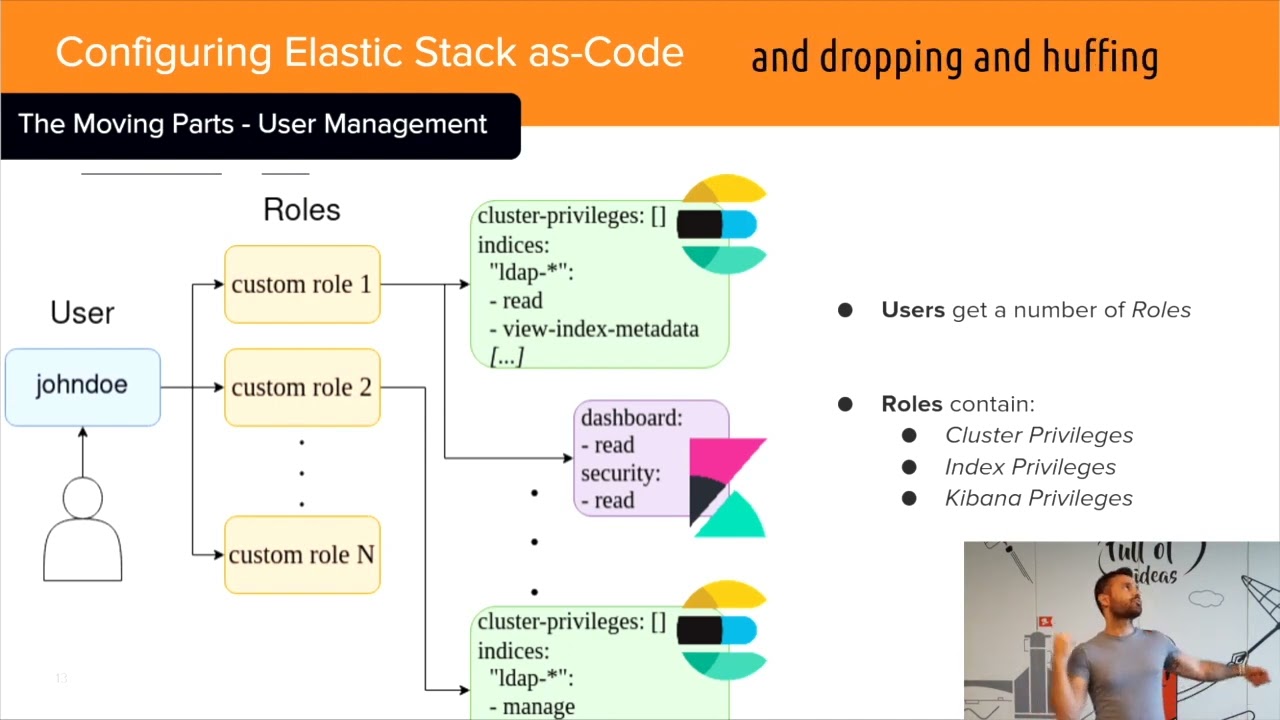
alright the same applies for users roles and privileges for the cluster and kibana dashboards rows have specific and can have multiple privileges a user might also hold multiple rows to perform its action everything can be configured of course by clicking and dragging dragging and dropping and huffing from gibbana but if you do it as code you do it only once and you have the ability to make to maintain it to review it and to monitor any change the elastic stack has multiple moving parts and its deployment includes organization specifics so you have to set up something according to each organization's needs these questions might look familiar to you tracking rolling back changes maintaining backing up logs mounting
users adding removing whatever clicking around banana can be from tedious impossible so we try to solve all of them with the s code approach now for a real example this is an actual module created to define a composable index template or a legacy one you can set up its type name and policy the alias the intervals and the charts and patterns shown on kibana dashboards even the pipeline and the mappings of special fields such as an ip address some fields such as the final pipeline and the static template mappings are of course optional this way you can configure and create a new template only as code down below you can find an open source telephone provider for these
configurations from field baker and we created modules based on this provider the snapshot module the snapshot module defines the chrome format schedule that the snapshot name where to store the backup and the indices that need to be backed up the index lifecycle management module defines or ilm defines the faces the hot wormhole and deletion alongside the max size and the days passed for its phase that means if we reach a threshold of gigabytes or a date we can move on to the next phase the ilm module might need to wait for a snapshot pipeline the pipeline module specifies some basic fields such as name description the time is the type is a custom field because or module can accept a json
structure or an inline penis script as a processor some new lines and double slashes need escaping to work their magic with both processors and it's not the most beautiful thing i know but at the moment it does a job and it does it pretty well finally the actual processor this is uh the heart of the pipeline this processor uses both a json and a painless script in two separate files for cleaner code and better reviews probably we could just output a whole script in one line but this is more readable this processor for example includes a group pattern that maps open adapt log fields to and a payload script that adds and calculates a new field if the event was
captured in companies of hours so with this script you can catch actors if they work at midnight thank you now is kiki hello i'm kj and i work as a security engineer at schools and in this part i'm going to explain to you how we manage to keep elastic cm runes exceptions and lists as follows let me give you an example to explain how exactly they work let's say that we want to create a rule to catch any dns that is not the cloudflare and the exception container contains two items so as not to trigger the rule only when a chromecast device is going to google dns and also when the traffic is coming from
guest wi-fi network the ips of chromecast devices are passed as values in the list item structure of elastic rules is as defined by official record of elastic detection rules rules are expressed as target files describing the rule giving some necessary properties such as the name of the rule a time range from one two sides indices for example five million patentee and the type of the rule that can be either a queen a threshold rule or an eql rule and here a very interesting thing is the reference of exception containers keep in mind that in this way we cannot create exceptions or lists with this in this so the way to overcome this is by creating exceptions as defined by
elastic exception api which can be expressed as jamming files the yummy file contains the part of the exception container in which simply we describe the items where every entry does have a log field and a value or a list to get it set against finishing the s-code part the lists don't innovate they are defined by elastic session api and expressed as yummy files likewise the exceptions the structure of the list consists of list containers and items a list container describes the list items actually and the list items include the values of the container that is the eyepiece of the broadcast devices in the example good to mention that the interconnection between the item container and lists
happen through directory structures as anyone could imagine maintaining such a complex structure for each cm rule is not used okay that's why infrastructure is one way so every scene rule is implemented by a terrifier provided abstracted by a repository template that manages the yaml and thumb files of rubrics exceptions and items hence the only thing you have to do is to write your own dom file and jump file all this code is open source managed with github workflows for automatic terraform plan and applying integrating with the official elastic detection rules depository is of course our best friend to review saints management this way no one is able to make a change on the repository without being firstly
included by the teammates thank you very much feel free to ask and canvas
Related talks
 13:12
13:12 16:01
16:01 23:54
23:54 20:40
20:40 46:38
46:38 33:37
33:37