Breaking the Habit with Continuous Security

Show original YouTube description
Show transcript [en]
but for right now we've got doula fari who's gonna be doing uh breaking the habits continuous security and uh you can join and chat in the discord ask your questions and i'll pose them on to do live so don't please take it away thank you hey what's going on everybody thanks for joining and good morning uh this talk is called breaking the habit with continuous security so my name is delev i'm currently the principal security engineer at wellsimple and prior to that i spent a few years with paytm f5 in cyberark i'm also one of the founding members of defcon toronto i'm super excited to be here today and we have a lot to cover so let's
start with the agenda for today uh so i'm going to start with the problem statement and then we're going to be discussing traditional security and continuous security and kind of do some some comparisons there and then i'll talk about an open source project that we released about three weeks ago and hopefully we'll get to the demo at the end so the problem statement of today is that in today's standards the pace at which we're deploying applications and infrastructure is extremely fast and there could be hundreds of deployments a day sometimes even more and what this situation creates is uh basically our infrastructure and our inventory count is continuously changing you could have hundred instances right now
and certain condition happens and and then next hour you have 200 and what this creates is a window of things that could go wrong because you're not doing continuous assessment of your infrastructure so it may look like like this consider this scenario as like your traditional like pen test or vulnerability assessment or just a scan you let's let's assume that you scan on monthly basis so you might be scanning uh on january 1st and you find a bunch of bugs or a bunch of issues that you need to address you patch them a few days later and then you maybe you run another scan uh or another pen test to validate that everything was actually addressed now
from this point on until the next time you're going to be scanning let's say that you're doing things like pci dss scans where they uh kind of force you to scan every month or every quarter then the next time you're potentially going to be scanning yourself is maybe february 1st what this creates is a window of two weeks that things could go wrong and you won't know about them so in this example consider that you have something like a firewall change that went wrong and somebody exposed something that they shouldn't have exposed and you end up with something like a redis instance publicly exposed to the internet um no now with this model you will
discover that potentially next month and two weeks time on the internet with the amount of background noise is a long time so we want to address this model to look more like this where we scan and we simply never stop and the intervals between each scan could be two hours or one hour or even less than that depending on on what you want and what fits your environment and if we do have a scenario where something like a firewall rule went wrong that exposed some assets to the public internet you will be able to pick it up just because of the nature of of the assessment that you're doing to your own infrastructure now this doesn't have to be necessarily
things that are publicly exposed to the internet you can apply the same principles also internally with that um when i spent a few years at paytm our scale was pretty massive so we had to address a problem of growth and also uh find the issues that we see pretty often so we had to come up with a kind of a scalable solution that will help us scale our detection capabilities in general across the company so we went ahead and kind of thought how an architecture like that might look like so i will start at the very bottom here you see that there's a node called scheduler think of it as the starting point of the assessment
this is the basically the the the node that is responsible for fetching your infrastructure data such as ip addresses or dns from your cloud providers and this node is then setting up all these ips and things that were collected in the database layer or like a queue for the ips and targets to be assessed and then you have the attack there on the top right and think of it as clusters of scanners that are distributed around the world and the reason why it's important to actually put them in multiple places is to remove geographical bias when it comes to how your infrastructure looks like from different places around the world if you do things like geographical
blocking and things like that and then our attack layer is responsible for looking at the queue picking up any new ips that were stored and and running certain test cases that we care about against those uh targets and when an issue gets discovered an email or a slack hook will get dispatched to the security engineering team to take action now on the left side the deployment layer this is where we basically come up with our test cases or things that apply to our use case and we write these small uh proof of concept code or small functions that test for specific things um that have high signal so we are really looking for things that have high
signal and i'll talk about that more a bit later and we will push that to a repo and our infrastructure will get reprovisioned with the latest copy of the code and any new ips that are already in the queue will immediately get assessed against those new test cases now on the bottom left you have the intelligent sources of where you can actually get these kind of logic from so one of the big things for us was our actually our bug our own bug bounty program because we were dealing with a lot of people who are participating in bug bounty uh hunting in general they have a lot of techniques and a lot of things that they
use um and this was used as a source of intelligence for us so if somebody found something on some uh some server we will be able to create this signature and we will then run it against our entire infrastructure and within an hour or two we'll be able to know if we have that same problem elsewhere in our organization and you can also do things like independent research if you have the resources or simply look at other bug bounty programs and their submissions to get some ideas around what rules you could potentially write to test your infrastructure against so we went ahead and actually built a solution and we focused on a couple of key points the first one was
we need actionable alerts and when you scan at scale you want to reduce the amount of things that you will likely ignore or we you will likely not prioritize so we focused at least at the beginning on things that are an absolute must fix and then we wanted to remove uh any vendor dependencies so we kind of started with showdown incessant and census as our sources of doing port scanning and service fingerprinting but the problem that we encountered very early on is that the data they have is pretty outdated so for example they might scan the internet every week and for us when we're doing continuous scans we want the data of the asset as it is
right now so we had to remove them from the equation very quickly and do our own kind of fingerprinting and poor scanning ourselves and then we had to kind of have a feature where we have a safe list and an exclusion list a safe list basically meaning that i will be able to say i don't want certain traffic to hit certain ips because of various reasons and an exclusion list might be i don't want any test cases running against any of my uh of this group of ips because maybe there are some risks that i'm willing to accept and i can address it right now one more key thing here that is probably the most important is capturing the raw
requests and responses that our attack layer generates this is especially important if you have distributed teams in the company and maybe your engineering team is somewhere around the world and your operations is on the other side and an issue gets created in a different time zone than your own and by the time you actually get to the alert that asset that was impacted is no longer there so you want to have a snapshot of the alert at the time that it happened so that you can then debug and address any false positives and see why the alert was raised um so before it's too late and then we needed like some kind of an alert management interface where we can
reopen issues close them escalate them and just take actions on them and lastly we needed that continuous deployment model when we introduced a new signature our attack layer will immediately get that that data and reprovision itself and any ips in our queue will immediately get tested against those new test cases so um some of the pros and cons to this approach um you will definitely absorb some observe some really weird anomalies when you scan at scale and you will discover some really short-lived issues that just simply don't exist for very long i'll talk about some of these anomalies in a few slides key thing here is that you will develop some ability to detect at least certain group of
anomalies within hours or less which is a great feature to have in general and one interesting thing is you will definitely increase the time you all you will increase the your chances to win the race of the detection uh in general against bug bounty hunters that have their own tools or even threat actors when you continuously scan yourself you have the uh kind of the advantage here because you have access to your dns and your ip data so you will likely win that race uh for the most part so this is a huge win on the downside though i do acknowledge that this model may not really work well if you have a static environment that doesn't
really change often or maybe you just don't have a lot of assets in general but it really works well and we we we have a lot of kind of uh things that we discovered over time that made us think that this works really really well when you're operating in large environments and lastly since you are operating and scanning continuously then you will generate traffic on continuous basis your ops you may not like that idea and i think that's the trade-off that needs to be acknowledged although there are ways around around that in general so i want to talk about some of the weird behaviors and anomalies that i just talked about so consider this uh application that is
behind the load balancer served by five different backend servers and let's assume that your fifth server at the bottom is vulnerable to some some issue and let's say that when you do a get request to a slash internal some panel is going to be exposed on that particular server now if you're doing a pen test you might not know about that at all unless you do five different get requests which will eventually lead you to land on the fifth server but when you do continuous scans you will hit your endpoints multiple times a day you have higher chances to actually discover these anomalies and this is something that is very difficult to manually discover so even when we get alerts like that
it's sometimes tricky to actually reproduce that unless we refresh multiple times for example so this is just one interesting case another interesting case is this is more classic examples of problems that happen if you have an aws infrastructure and multiple people have access to it and let's say that now with the work from whole model somebody is creating an asset that is publicly facing because they can be bothered with vpn and they basically end up exposing some instance with their services to the public internet um and and maybe it's only for an hour or two but you have this window of something that gets exposed that you won't know about but if you're doing if you have like let's say a cluster
that continuously takes those ips and you have multiple scanners let's say in europe and maybe canada as well you will be able to pick up that anomaly and if you if an alert is raised by some ips that you scan from that are not on any allow lists you definitely know that you have an issue so this is just another example of the things that you will likely be able to pick up now i want to focus uh on the solution that we actually built in open source so we took all the logic that we had in-house and we kind of packaged it made it more generic and released it and we call this this
thing project nerve which stands for network exploitation recon and vulnerability engine i do want to give a shout out to paytm that actually allowed us to open source this for the benefit of the community um so with that uh i'll talk about some of the features uh the key features are the rest api in my opinion you want to operate uh as much as you can automatically but we do have a graphical user interface that you could use to do the scanning that you would do in normal vulnerability scanners through the ui we put a lot of emphasis on high signal detections things that we cared about and things that we feel should be tested like certain test cases
that we we simply just cared about more than others we also didn't want to do certain test cases that will might that might produce false positives there is a certain balance that you have to consider when it comes to which test case you're gonna run versus uh the the the true positive ratio so you want to you don't necessarily have to detect everything under the sun but the ones that you detect you want them to be true positive so uh more on the features we do support notifications in various formats and reports in in different formats you can customize the configuration of the scan in multiple ways and i'll talk and show how a configuration might look
like it's extremely easy to deploy and it's you're up and running in probably less than three minutes uh it's all scripted and if you want to use a docker container you could if you want to install it on a vm you could as well and we're not there to replace your traditional scanner so it's not an asv replacement if you are using things like qualis or an ss4 pci dss scans or some other things uh we're not an asv and we're not there to replace it and you can see the link here for the github project it's also going to be at the end of the slide so some of the detections that we we do
have are around these kind of categories on the left so we do things like subdomain takeovers and misconfigured frameworks and so on so if since you will likely pull your dns data and feed it into the system we can do things like subdomain takeovers i do believe that we have a dedicated besides talk just on that topic so i highly recommend to actually tune into that and we're also looking at things that are uh somewhat misconfigured frameworks category of issues i would call it and this is where the core of the detection is so django is a great example django is a web framework and if you just kind of use it by default it comes
with a built-in web server now if you choose to use this built-in web server and you for example left the debug mode on if you do a get request to a django server to a path that doesn't exist it will happily throw a lot of information back at you with the routes that it does support so we actually look at that level of configuration when we i try to identify these anomalies we're not blindly setting traffic for the most part sometimes we do sometimes we don't but we try to be as focused as possible on the actual service that we are encountering uh brute force this is not new to anybody but we can actually do brute
force attacks with the list that you will provide us with and i'll show you how it looks like a lot of information disclosure techniques for various technologies are built into this there is a lot of signatures for sensitive panels in general so things that maybe shouldn't be exposed to the internet or things that maybe you don't want certain ips to actually reach out to if you're scanning internally and certain best practices that we baked into the platform in general there's more on on the detection side feel free to check out the github link for more information on the platform in general so if you do want to get started with this there are basically four steps you
need to do one is you deploy it and you can i highly recommend to deploy in multiple instances ideally in maybe a cloud provider that you don't normally operate in to have like a true uh blackbox kind of perspective and then i think the only part where you need to do kind of extra work is to actually do the collection of the targets so maybe a script that will call aws api and gather things like publicly facing ips or load balancers or uh databases and so on we don't do content discovery at this point it's not necessarily about bounty hunting tool it's more there to integrate with your processes internally and kind of protect it from
the outside or inside depending on how you position the the platform itself and then we have the api so you will take all the list of ips that you gathered in dns and you'll feed it into the api and then the lastly you're going to act on the results so there's an end point you can call to get the results as soon as something found you don't have to wait until the end of the scan and then you can uh kind of trigger your logic or your processes internally to do things like sore flows or a bug tracker ticket or just do manual analysis on the finding itself so with that i want to show you a little bit about how the
platform looks like from the graphical user interface standpoint so um there is authentication i'm already authenticated to save some time but uh the assessment basically is where you start defining your scan this is not different than like a traditional vulnerability scanner where you define how like the metadata about the assessment itself um the targets that you want to scan so again everything that you see in the ui can be done in the in the api and i highly recommend to focus on the api versus the ui because it's just more scalable to do that with automation so you can define networks and domains and exclude certain ips from certain networks if you want to exclude certain targets from your scan
in general and you can define how the configuration of the scan is going to look like so you can toggle off and on certain behaviors if you don't want us to run any like denial of service uh rules you don't you don't have to use that you can define how aggressive we're going to be which will ultimately decide which rules we're going to run and how much traffic they're going to generate you can customize the ports that you want to look at maybe you want the scan to be a little bit faster so you can focus on maybe just the first 100 ports or the first 1000 ports it's totally up to you you can define the parallelism of how
many groups of ips were actually going to scan and attack at the same time this is kind of the bring your own dictionary part you um you could do things like a sanity check against your infrastructure if you supply let's say no list of users that you found internally in your company and maybe passwords that people tend to use and you can use that as a sanity check so when we discover let's say a publicly facing ssh server we will try to probe it to see if it supports passwords and then we will take your list and try that against the server so my suggestion is don't necessarily do like a full-blown brute force attacks against
your infrastructure more often more like sanity checks so that you don't compromise on the speed of the entire process on the schedule tab you can actually define uh the uh the schedule how many times is going to run is it just going to run once or run continuously i recommend to run it on continuous basis and you can define a webhook that will ultimately send a json payload to an endpoint of your choice um and then you will be able to act on that information or you can just simply use the api you could set set up email settings so that we can notify you via email when something is found or a slack web hook
whichever way you choose is good enough now once you run a scan there's a dashboard that you can see kind of the basic data of what was found i ran this locally on my network so there's not a lot of interesting things here but um basically it will give you the breakdown of the severity distribution and the core distribution and the hosts that were found up and running and you can also see like the assets and the ports that were open and services that were discovered the interesting part though if you scan a lot of assets you can see like a network view of your kind of a bird view of the assessment so if you have large clusters
around certain assets you can zoom in on those and see which issues were found so you can see for example that on the left side i have something on my home network that has an unencrypted login form so something that has that accepts password but it's not served over https as an example you could get a list of all the vulnerabilities and see that data within them or you can simply just export the reports and get a very basic report with all the findings and the recommendations how to fix them another interesting thing is you can see like a console view of the assessment as it's happening um and if you if you're not interested
in any advanced configuration you can simply use like the quick start to actually run the scan without worrying about any of the settings so one thing that i mentioned was about the configuration of how a scan is kind of created so we do accept like a json config with various uh settings here that you can customize so for example if you want to run a scan on during business hours but you don't want to be aggressive you can then call the api uh at a particular time of the day and just tweak it so that it's less aggressive and maybe during the night you want to be more aggressive it's totally up to you and you could you
can customize that uh you can also provide a dictionary 3d api just like i showed in the ui these are the end points that we currently have in the rest api so you can submit a scan you can get the results you can actually dynamically exclude certain assets uh if and bake that into your logic you can check if updates exist so basically everything that you see in the ui is supported through the api um if you are interested in knowing more about the low level details of how we execute scans when we simply provide us like with the basic quick start scan everything is documented here in terms of how it looks like i do want to i know i kind of ran
through these because of lack of time but i do hope we have some time for questions and with that i hope you check the github repo link and contribute as much as possible awesome thanks a lot yes you you have a question here um and that is what do you think of the idea of some kind of integration with audit trails for network devices slash servers that is actually i think a great uh would provide great value anything that you could use to discover more about your infrastructure is valuable great great yeah yeah i think that clarifies the uh the further um the secondary question part to that question i should say is um is around
could could it be used to speed up detection or is it just like auxiliary information um it definitely can speed up detections especially if you don't have anything in place right now that does a similar thing because of that infrastructure continuously changes you may just face a situation where things just get exposed because of speed and because of scale so it can help you at least build detections if not speed them up um and this is i think especially true if you have a large organization cool thanks for that um so far that's all the questions that we have uh we may get some more um overall people are thanking you for the hard work that you've done getting that
github up um so yeah i wanted to again thank you for doing this talk with us thank you so much for having me thank you and um we're about to break for for
Related talks
 27:38
27:38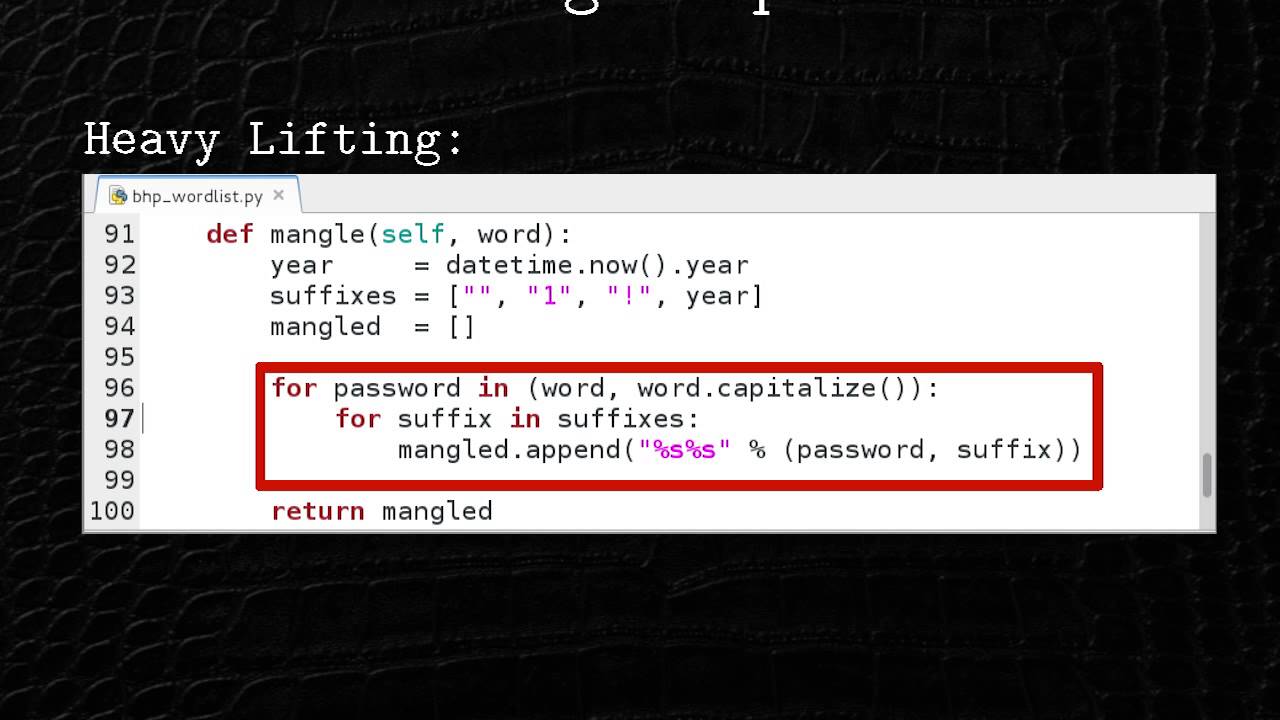 19:32
19:32 32:02
32:02 24:45
24:45 25:11
25:11 26:03
26:03