Forensics: We're Not Just Byte-Sized
Show transcript [en]
So everybody great to see everyone. Um this is going to be just a bit of a quick talk on some forensic data acquisition processing and analysis at scale. So who am I? Um currently in the IR space at KPMG uh cyber response services team. Previously I was at uh Windsecure Fecure WR whatever they're called this week um in the account department working as a threat hunter nured on all of the two and three letter acronyms um and yeah my spare time I'm found up a hill with a brew basically being a hobbit um which I admit to so what are we going to cover so cover some of the limitations of our current approach to digital forensics
what we got to think about when we are trying to scale digital forensics, how we do it, some quick wins using a bit of science and then a few case studies, got a quick demo video uh for you at the end. So let's just get cracking. So how do we currently do small scale instant response? So if we're assuming that this is a walk-in, you know, we've got no assets deployed, we don't know anything about the customer. So what we'll do, we'll either get them or we'll go on site or teach them how to get either a full disc image or uh triage pack. So this is normally, you know, we get the data, we get them to upload the data. Um
depending on sort of where they are in the world and the sort of connections they have, that can be a massive problem. Then we get downloaded to our analysis box. I live in the middle of nowhere. That's a problem. Um, we'll run some stuff on the data that we get. So, one of my favorites is Cape, um, Chainsaw, we can run Axium, Xway, you know, all the all the forensics tools that are out there. And then comes really slow bit in that we select a single data point. We see if it passes the sniff test and then move on to the next dat point. Repeat essentially add the new pivot. Um, so that's great, but
if you got one box, if you're in the like a police setting or a law enforcement setting, that's great, but there are some drawbacks with it. So, first drawback we'd say is effort scales linearly. The amount of evidence items you have, you have one host, it's going to take you a tenth of the time, but 10 does. And also if we have any change in IOC's or attack TTPs during that analysis we got to go back to the boxes we've already looked at. We've also got limited disc space. If we've got a terab of um this image that's great. If one box is 6 terab and we've got a dis image where on earth are we going to put that?
And also when we are processing those images and those tri facts, everyone reviewing it normally has to download it to their own machine. Best case scenario, they're downloading process data. Worst case scenario, they're downloading your evidence data. This makes everything ridiculously slow. So let's have a bit of change of mindset on this. If we sort of take what is roughly what we're going to be doing part of that digital forensics workflow. So we're going to acquire the data take the raw artifacts make process ones thinking like NFP for example binary we store the data somewhere and then we get on it somewhere. This is very simplistic but if we think about this then if I think it from a
data science point of view well we roughly map here onto extract transform and load that is sort of the standard operating procedure for a lot of data science work. So when we start viewing it through those that lens, we can start to have some really good possibilities. So we quickly go through what we do those steps. So extract really depends on what data you have. So if you've got WOs, they might be in CL. If you've got a pop Windows DC, well, if you want a quick um analysis, you might use some C to get a triage back. So for the initiated drawback is essentially the the files that are used forensically and none of the fluff
we get full disc image that's where we'll get you know user files we'll get you know uh Bob's desktop we'll get everything the the thing that's really interesting about this is you can in theory scale any of these as long as you're willing to put in the code and the time you could use PS exec to create a triage pack on every host in your environment. That's doable. But if you've got things like a dis image, great. You can get a disc image on every host in your environment. Where would you put in that? Therefore, you're probably best to use something like Velociraptor that is already built for that scale. So for processing um we're going to use
the uh Windows example. Um you're going to be probably thr and that's great. Again you can scale that. You can use s exec but the problem is you're probably running a windows box. You can scale command lines but scaling the windows box that's what's difficult. However, here in comes our secret source power to scale. Most Eric Zimmerman tools now support net 9 cross compiled with the Linux native. There are also some scooters tools such as chainsaw which is written rust which is also natively crossplatform. So we can compile that into a native file as well. Um, most of the Zimman tools work as um as Linux binaries from memory. The one that's really been annoying me is in
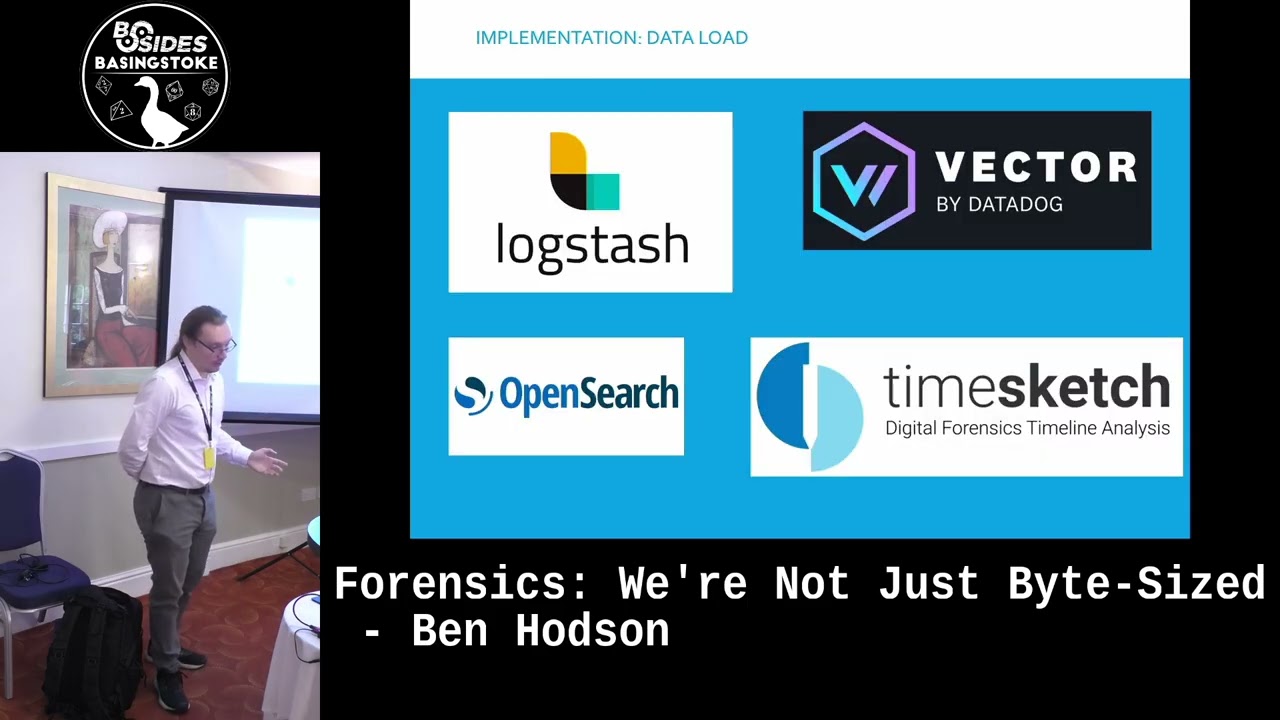
PE cmd cuz it still requires a Windows binary to run. I will probably try to figure that out, but I haven't as of yet. So, and just to to wrap this this off down the load, we got to throw the data somewhere where it's useful. In terms of how we get that data, well, log stash is a is a frequently used one. Um, I we used this at the start of this project just for familiarity reasons. We're now moving to Vector, which is a lot faster. And in terms of where we're getting the uh analyst eyes on it, we currently use open search because Amazon managed and also we're familiar with it. Um things like time sketch as well are really
really good and got any experience in time sketch. I'd love to have a chat with you after this is something that I've you know sort of semi- recently found I'd love to take a bit more in. Oops. So once we've got the data into the platform be that you know open search time sketch whatever we need to take that apart and derive useful findings from it but here is where scale problems again we've got loads of events loads of different systems going into open touch that's brilliant but then we still need something to look through and to get those useful findings we can start to implement detection system that will cut down the number of
things we need to look at as analysts. The way that we choose to do it, oops, playable. There we go. Um, is Sigma, which runs on top of Chainsaw, available for event logs. Um, again, really, really good because we can throw that data into open search as well. And we can build lots of quick dashboards, which I appreciate, but probably won't be able to see. Um, but we can look at all these pre dashboards and get some really good info. But once again, we have that scaling problem if we get loads of detections going into open search. Again, great. But we still got to look through it. Now, this phrase that you see here, data
volume creates data context. This is something I I talk about a lot when I'm trying to teach analysts about this and it's it's a phrase that I find is really really useful. So come with me for a bit of a bit of thought experiment. If we got a host, we run a detection system on that host. Well, the detection system will pick up false positives. It's just how how it works. But those false positives will be standard user operation you know Windows stuff in the background but also you know admins doing admin things whatever whatever they want to do but statistically the false positives are significantly greater in number than the true positives we hope.
But if we scale that to 50 systems, well then those proportions keep going and keep getting higher. Say we've got a 99% false positive ratio, right? So if we've got all this data, theoretically the abnormal detections, the statistically abnormal things will be much more likely to be true positive because if it's 99% false positive and we've got 15 20 systems in there, well, the stuff that's only on one host out of 15 and is only like a couple of detections is going to be more to be true positive. Um for that example there, that's a real example. Um of those I literally just sorted by number of hosts, uh the only two that were false positive were these
two. So those are high level detections. They're not critical. And most of those top ones, which as you can see, SMP mimic apps, not something you want to see. We can also exploit existing data relationships. So again, apologies probably not back. Um when you get a compromised user, that compromised user will sign in around environments. They'll be generating 4624 type 3 events where they go. Well, if we have all 46243s and we have the remote hose they came from, we can just put into a network graph and map where they've been on the environment. Again, an nice but real example. Um, we had a couple of users that we were ticked off uh that they
were um they were compromised that come from the client. Um, so we just grabbed all the 462 balls we could and found out exactly where they went just by throwing into a graph and also kind of like graphs. Now this example little bit more dev work but still quite useful. So this is something we did quite a lot when I was at counter steps. Um here we have the detections coming to our open search. So what we would expect to see on a normal data will be detection severity along bottom going in increasing severity and we would expect to see that curve to be inversely proportional which is that sort of shape. However, whilst we see that sort of
shape, detections go info, critical, low high medium which doesn't work. Therefore, what we can do is go okay, if we know that those relationships are skewed, data is more like to be true positive. Well, let's think about this as a as a machine learning problem. In the machine learning world with classification, you require a label data set. Well, we can quite easily get a label data set because if you look on GitHub, there's loads of ETX attack samples that we can run the same detection engine on as we run on known clean systems. Therefore, we start to build that classifier that was only 1,700 records. um it's probably overfitting quite a bit but this was like
two or three hours of dev work I'm sure if you get data scientists on it you know you can then look okay which detections are statistically more likely to be true positive irrespective of detection severity right because that severity graph is unreliable of course so this is where a lot of the bulk of our effort is going to go. So, this is going to show you sort of roughly where we're at in terms of our own implementation. Um, and I'm going to give you a bit of a walk through on the detection logic and analysis logic that we can go through for this. So this is roughly what the the project was at at inception. Um it's a lot more
scalable than we were before. There's a bit of automation, but it's not it's not great. It can handle quite easily when a client is going one triage pack at a at a time and those in the space in the room will know that that that is quite common and especially if they're they're running around you know grabbing stuff from air gap system or or whatever. So what we do client will upload it to an S3 bucket. The analyst will then download the triage pack to their own machine and then point it and upload it again to our processing EC2 instance sitting in Amazon that has the eximament tools has tren before we worked out that we could port
net 9 to Linux. It was all running in wine. Um which was exactly as junky as it sounds but somehow it worked. Um we got chainsaw running and we also have log stack running on the same box throwing the data into a managed Amazon open cluster for us this is sort of tried and tested it's actually still there um but just for for ease of use that that's doable right we can just vary what goes into the S3 bucket because we're manually uploading it so to just walk through what we what we have This was one of the cases that used that particular system. Uh we had 43 systems ingested. Again, real compromise. Um 3 million documents.
There was a DC there, so it's not going to be, you know, 1 million each. That's probably out at that, but that's not reflective. uh eight different data sources. We had you know MFT and cache uh EVTX um and the ETX nodes and millions 248 separate event channels were coming into that box. This was a ransomware incident so we can assume we're getting some encrypted files again. Appreciate those at the back you can't see this. Um so what we did is we made a quick graph of NTFS record changes per extension. This again thinking of data science terms. This is technically a velocity of NTFS record change. NTFS records can change when an extension is updated. So this is
essentially a graph of velocity of extension edge. Filter it for our suspect time period. Lo and behold big spike we got black suit. So there's our malware that's our ransware varies like that. Next all we do is go on the same m and across all systems look for anything with the black suit. Those are all our affected hosts. Again, relatively simple, but really good value. Next, search for any detection that's any way related to black suit. That first example is file.exe on Dave desktop, which Sofos AV pulled out of black suit. Great. Then we know file.exe. We can then pivot on ancache to get evidence of execution across the environment for file.exe. This was on completely different host
than was detected uh in the uh example. Then we can pivot on sort of Dave's user directory. So, desktop downloads, documents, the whole thing. Um, we then found two additional files. One was an exe, one was a cis. That was the edr that they used. They got annoyed. So, kept detecting. So, we gone from literally not knowing what malware variant was there to, hey, this is the file name. We can probably get file hashes out relatively easy if we have discs. We've got evidence execution and we've got their defensive in what four five searches. So that's that's really quite quite useful for getting those findings rapidly because again as people in the IR space in the
room will know you don't have a lot of time normally. So this is our sort of latest iteration. Um we've made pretty much everything changed. So if we want to scale getting that initial triage pack, we can use velociaptor. It's not really what velociraptors are designed for, but pro this works. Um we can also still upload stuff manually. That that works. And that's what I'll show you in the the quick demo um video on the next slide. Um the that then goes to an S3. That S3 will then trigger an S3 event notification or the upload and will trigger a lambda function. That lambda function will spin up an ECS cluster. So uh one uh one container per pack that's
upload. Then it will pull the file down from S3 and run all of our process tools on it. So change CN whatever tools want. It will then reord the data back to S3, trigger a second S3 event notification which will then spin up a second ECS for ingest. Now that's solving a big problem that we have in that tools especially EBTX, ECND, especially Chainsaw would use all of the resources it can get. log also we wanted to use all of the resources it could get. So basically we just had to keep trying to scale the box and that became a so we're splitting them out. We're also replacing log stash with vector again sort of
similar function but it's also a lot fatter. Not only is it a lot fatter, we're going to spin it one per evidence item. So you know JSON output from um aash process right we're then going to throw an Amazon open search serverless in uh instance because the thing with serverless is that they'll just keep they'll spin up the capacity that you need for um for ingest. you know when we were stuck with Amazon manage it was right okay we start the ingest and then you just see the red line from the ingest um instances in Amazon open search um so getting rid of to manage thoseelves really helps with that so next slide will be a quick video demo
but concentrating on just the transform and load um because weirdly a no wanted me to test this quite experimental thing in their systems for some reason. Um so this this is not going to be test of veloc
the the next the video. Cool. So let's just trigger this. Okay. So S3 upload. We're then waiting to see whether the uh Lambda function triggers from that S3 notification. Give it a couple of seconds. Cool. So that is the S3 uh notification JSON coming in. It then triggers the first the processing ECS. Um, I haven't cached everything properly for this demo, so it takes about a minute to kick off, but you can, there are tricks you can do to sort of make that go a bit faster. That's And then here we have the uh processing tool running after the download from S3 to the local ECS and then it back up. So cool. Now we can see that all of the
vector ECSs have spun up. Wait for them to get going. Cool. They are now processing all of the data and they're going to be throwing up to open search. We let them do their thing. We can then move to open search. Give it a couple of seconds for the ingest uh instances to do their thing. And we've got data coming in. And we hit that clock at about what 4:45. Um, this exact same example on the first iteration took about 10 minutes for data to start coming in. That's how star resources everything was. So, we've got 18,000 events coming in um within 4 minutes 42 seconds, 52 seconds, and the rest came in probably about another 30 40 seconds
later. Um so, yes, it's expensive because you're spending loads of ECS, but frankly, it's L ECS. It's a lot less expensive than, you know, 16 gig EC2s out there doing nothing for 90% of the time. Um, so yeah, that's sort of some of my adventures in trying to scale instant response.
Related talks
 19:14
19:14 27:03
27:03 35:45
35:45 32:45
32:45 31:33
31:33 30:35
30:35