Purple teaming with Elastic Security and Prelude Operator
Show transcript [en]
good afternoon b-sides my name is james and i'm here to talk to you today about purple teaming particularly with a tool called preload operator and also elastic security i do work for elastic myself so i'm a product marketing manager at elastic focusing on our security products uh but the stock is going to be very besides and community friendly and it's always a pleasure to be able to talk at these events and we don't have too much time so i am going to dive right in um and i'd like to start off just by introducing the the concept of purple teaming for those of you who might not be too aware about what that is so it's not a new concept right purple
teaming has been around for a while but it has gained a bit more traction in the past couple of months or even a year or so i would say and the whole point is closer collaboration between a red team and a blue team and a lot of people know what a red team is or people trying to exploit their own organization whether that's a pen test whether that's you know running adversary emulations by any tool they prefer and then we have the blue team side of the house which is typically um trying to detect all of this behavior purple theming brings those two teams together in a very close collaboration exercise rather than having direct team
do their thing and the blue team do their thing it's all about the red team trying things and helping the blue team understand what they might have not detected and how they can help detect and vice versa so if the blue team detects something and the red team wasn't expecting them their their you know emulations to be detected in that way they provide that feedback loop and they also provide an end-to-end performance of that exercise back to the business or to whoever the stakeholders are so just really close-knit collaboration between the two teams rather than you know there's this a lot of a lot of times we hear like the red team saying oh we we're the best we
we defeated the blue team entirely this takes that approach and and throws out the window it's all about really close-knit collaboration between the two because at the end of the day their goal is the same to help protect their organization better so that's the concept of purple teaming really and obviously the name purple is derived from blue and red which makes absolute sense what are we going to look at today so there are a whole host of tools that you can use for uh particularly for adversariation so you know common ones like caldera it's on the red team red team automation infection monkey there's way more attack iq so there's so many dimensions uh there's
even tools focused on reporting perpetual metrics like vector and and also from the blue team side and then there's all your traditional sim technologies or security analytics and obviously elastic security as product um or as a platform i should say covers that side of the of the purple team really well as for so the blue team detection reporting and even data collection site which we're going to see i'll be using elastic agent um pre-load operator it's fairly new in the space as a as a tool for it for simulation but they have some really really interesting um features available uh which i really really like so that's why i'll be talking about it today and with that being said i'm just gonna
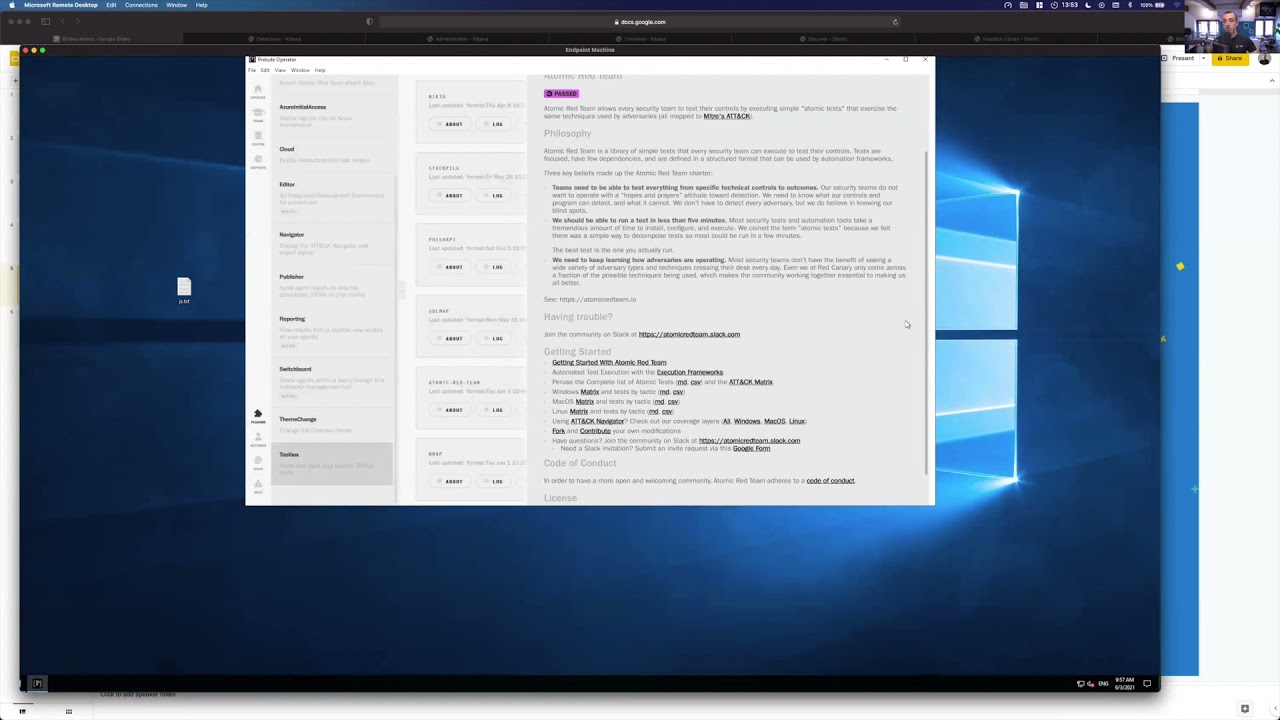
dive right in because we don't really have that much time so let me go right into a demo and i'll start off by talking about preloads the i pretty operator i should say so previous the company operator is the product and and i am running prelude operator on just a standard windows machine and preload the operator i keep saying preload i should be saying operator operator itself is totally cross-platform so you can run it on whatever operating system you want in fact you can see i have it here on my mac as well if you can see down below on my screen and i'm just going to be running it on windows just for the sake of this demo and there's a
bunch of features i'd like to call out first so the whole concept with an operator is you deploy adversaries you can either schedule them to run or you can run them manually and they provide a lot of ttp so tactics techniques and procedures that you can just start to immediately use and you can see this via their editor plugin hopefully this is coming across on the screen um but you can see here there's a lot of tactics you can choose from some of them are tagged by particular adversaries or particular situations and outcomes or maybe even things like recent vulnerabilities you've seen like a hefnium and then you click on the tag and you can see the actual ttp
and exactly what it would run and you have you're free to edit these as well that's why we're in the editor here so a lot of flexibility everything is explained really well which is one of the things i really like about it and they tell you what if if any sort of miter tactics and techniques they cover if it's deployed to any adversaries already so all of this is really well explained so there's a ton of these that they provide however there's a few other tools which are really really cool so um i i don't reinvent the wheel here so we will be talking about existing tools like i already mentioned atomic red team from red canary
and they provide a ton of ttps which are very very popular and what preludes have allowed you to do with an operator is you can leverage those if you want or even leverage any for example existing color plugins even though they have their own ttps you can use whatever you're more comfortable with and for the sake of this demo i actually did that i loaded up you can see they have import atomic red team attack files i've done that and if i go back to the editor you can see that i have a whole section where i've just very simply imported all the atomic red team files and you can see here very very easy if i wanted to change
them even though they are important from atomic red team i can just do that here so now instead of me having to run these um atomic team ttps manually or have them stored separately apart from my other tools i've just put everything into one which is really really nice and again really easy to to run as we're going to see easy to edit easy to modify and to deploy to any adversary so that's one thing i wanted to highlight with an operator that you can really use any sort of ttps you're comfortable with another thing they provide is which is really nice is the ability to load up any tools that you like using so if you have a project within github
which you track uh again atomic rating might be one of them but maybe caldera or anything else or any other community based tool that you really like and you want to keep track of it's sort of any updates and stuff you can add those right here as well so you can see for example atomic grid team i'm synchronized with the with the github repository within this toolbox and i can see all the latest and greatest from that repo without having to stay going to github and one of the things obviously at the elastic that we provide from the bluetooth side of the house is a lot of detection rules so we should we have over i think it's 550 detection rules
which are all public and i get super positive for anyone to use and contribute to and i have that hooked up right here as well so you can do stuff like that so you the the concept of integrating tools that you might be already using is really really handy another thing is you might already have an existing blue team infrastructure so you might have a sim you might have a security analytics tool you might have something like elastic so what preload have provided through operator as well is the ability to deploy attack ranges and even something they call their cloud redirector so i'm running operator locally on a machine but as we all know in an enterprise
that's not going to be the case so what you can do is you can set up sort of like a cloud redirector and have remote agents report into that redirector and you can have everything managed through there it's really really nice and really easy to set up but you can also see it set up here um an elastic range if you wanted to and they're already utilizing some of our latest features like uh fleet so centralized management so you literally just put in your fleet url and the free token and it will not only deploy an agent a fleet agent i should say an elastic agent on that host but it will also drop an operator agent so you're with
one click you're basically deploying um a data collection and you're going to be have the agent that's going to doing the adverse emulation on that machine as well in one click and it's not just elastic that they do this for so there is a you can set up a similar thing with splunk and a few others as well and then they even have things like integration with azure and stuff so there's a really really rich set of features within operator which is one of the reasons why i like it because it just makes things really easy for for teams so let's run an emulation exercise so i'm going to go into operate and i have my host here and
you can see i can just immediately deploy an adversary i can create an adversary on the fly and remember an adversity is basically a collection of ttps um i created one for b sides i've already deployed it but we can deploy it again so i'm just going to deploy it and you can see it immediately starts running on my host if i was using the cloud redirector or i had another host i just simply picked the range of machines that i want to run it on and i would have deployed that adversary on that machine and you get um as it's running you get sort of a like many other tools you get a immediate feedback loop
and so this is just running one of those ttps which requires 7-zip um and it's all happening in the background and you get you can see everything that's going on so if something failed you can see why and for example this is trying to query domain computers this machine is not part of a domain so that's very well explained and every single ttp is also really well explained excellent so that's the verse here is ran so from the from the red team side they're doing their job um what about the blue team side where does elastic security fit in and this fits in in many ways so remember the whole concept is we're running an exercise with our
red team and the blue team needs to determine hey did we detect everything the red team ran if not how come do we have missing detection rules are we not collecting a certain data set that we need to be able to detect this and did something fail and did they deploy a new technique and that's the that's what we're going to start doing inside of elastic so this adversary has ran or still running and at any time you can clear any pending procedures or pending ttps that need to be run but let's um let's dive into elastic the elastic side now so i'm just going to put this machine aside and we'll start off in kibana so for
those of you aren't familiar with elastic cabana is our user interface we have a dedicated security solution which is which is what i'm in here and everything you're seeing comes out of the box i have not done anything custom about what you what you're seeing right now um and it's all part of the the free version so none of what you're going to see is a paid feature so you can start running this immediately today uh without ever having to pay us in so we start off uh particularly from blue team you typically start off with in your detections view right so what have we detected as part of this running exercise and you can see here within the
detections page i have some detections that fired from earlier today some will fire again as i as the new emulation ran but you can see here within the detections view i can clearly see already what's what's starting to happen so i had rules like encoding or the coding files were asserted till and i can clearly see that it was running out of operator but what's nice about it is even without the red team telling me i know what was run because of the the way we collect data and all of this data by the way so on this machine if i just bring it back we do have elastic agent running with endpoint security so we have an
endpoint security integration for our agent which is basically doing all the really rich data collection it also has malware detection and prevention running on it which is also part of what you get included for free so you will see for example some malware alerts trigger because of some of the payloads that operator uses or even autonomous red team have some malicious payloads as well so we pick those up anyway um so you can see this is one of the hero malware detection alerts atomic red theme this particular executable is determined to be uh malware but you can see how easy it is to understand so what i like to do in this case because there's quite a few alerts
coming in when we started running this exercise now the from a bluetooth perspective we have to try and determine number one is everything part of this exercise so there's an easy way to filter those out when you use a specific tool but number two did we detect everything or are we just looking at or is some of it coming in as data without detections and a really easy way to start looking at that is by we can apply a filter and we can also look at that in what we call our timeline in fact i have a prepared timeline just in the interest of time and the timeline basically allows you to to search across all your data sets
for anything you want and you can see it's a very similar view with what we call those row renderers and but it combines the detections and also the raw data so if i so i'm missing something i can get a bird's eye view of it right within here and you can see i applied a filter i have a saved query here which basically looks for um which basically shows me what's coming out of the operator directory and i'm excluding the actual operator process itself just to make sure it doesn't get convoluted and you can see today i had 193 [Music] logs essentially that match that and you can see some of them are in yellow which means they were detections
some of them are not so basically what i'm seeing here is i have a very immediate indication that listen my red team is doing something with operator and i don't have a corresponding detection for it so that's number one that's metric number one where we have the red team doing stuff and we didn't automatically detect it we have the data coming in which is fantastic but we haven't we did not have an out of the box or i should say a pre-built detection rule whether that's one that elastic has given me or one that we've created ourselves in my environment i have not turned all the rules on just for this exercise because otherwise probably would have
detected everything but i wanted to show you how easy that would have been um so you can see here for example i can switch i can pivot between just viewing the detections or just viewing the the logs so if i wanted to just say okay what did we detect during our emulation exercising our purple team exercise today i can just show the detection alerts and it will only show me the detections and then i can pivot and say okay we have these detections what didn't we detect so i can exclude the detection so pretty much what's not in yellow is a miss from my part it's something that uh obviously during a demo i get a few
errors but that's okay it wasn't too bad but you can see we have the all the all these and yellows were detections so we had five detections today some of them might be repeatable so if we look at for example the name of this detection we can see what it is so i'll just pull up the details here on the side and it will basically give me the detection name and but i can see exactly what was run as well uh my instance is behaving a bit oddly today no problem let's woke up so you can see this rule in particular is powershell spawning command prompt and i can see um if i tell you exactly what happened
here which matches that description so um james on this host and this on this domain on this host and this directory started command prompt with these arguments so you can see group domain computers and via parent process powershell so we detected that via this rule and we also have some other views that you can look at this as well so if i click on the what's called the event analyzer i can see the the full process tree it might be easier for some to understand and digest what happened when the when the the red team ran that exercise so we also have this view as well uh i would just let this load for a second because today my
uh my instance is incorporating of course whenever you do a recording a demo uh it always happens but you can see here there we go so i can see a launch fire operator we can see powershell response command prompt response i'm doing that query for the domain groups by the net process and i have all this information that i can see right here so some people might prefer this view which i like which i like that you have the option uh rather than just looking at the text itself when you're going through an exercise it's important that you keep track of this right so as you're going to the purple team exercise and if you spot the detection what i
like to do is we can open up what we call a case within elastic security where we can keep track of everything we've detected and you can see i also saved this as a timeline called b-sides but you can typically in reality if you're running an exercise you would call it accordingly but we have an option here to add an alert to a case so i'm going to go ahead and do that i'll add this to a new case and this just really helps me keep track of like here's the case for our purple theming exercise so we can do that here so i'm just get rid of this and i'll turn it off so
teaming exercise as an example there we go thank you spell check i can put in a description i can i can even synchronize with the third-party system and let's not do this for now and then i can put in a description and it will add that alert to that case so i can keep track of everything i've detected during that case on the inverse side i can say what data has come in via operator that we didn't detect so i'll just open that again so we can do the inverse right i can basically instead of looking at just the detection alerts i can look at everything or just the events in this case we just look at the
events and we'll see the difference so this is important because now within one view i have i know exactly what my red team has been running i know what we've detected thanks to our predefined detection rules and i know what we've we've looked what we've collected but we didn't detect and all of this was done through the through the whole timeline function so obviously and then if we detected something that we didn't pick up so here we picked for example whatever was ran we can see started process 7-zip and we ran these arguments and via command prompt we didn't detect that so if i wanted to create a detection rule for it and i can do that so we can literally
if we wanted to look at uh creating a query just for that so there's multiple ways we can do that with an elastic and it's all defined within the same view so we have the detection engine there's something else though so what's nice about operator is and just bring that into focus again as you're running an emulation it creates a report so you have a nice reporting view but what's even better about it is you can continuously feed this live into a tool like elastic as an index or you can export it as a json file if you wanted to i'm doing that in the background so what i've done is all this data so not only am i
collecting the raw data as the result of the emulation but i'm also collecting all the emulation actions why don't we correlate that right so what uh what um operator does as part of that report so this is like the raw data but we'll look at it inside of the timeline as well so they provide as you're running ttps you can see the the process id of the of what was ran you can see the request that was sent from operator and you can see the response of something failed something wasn't successful if something was successful you get all of that back you get the technique so i'm going to correlate this data with the data that i'm bringing and i'm going
to use um eql for this so we have a event query language within elastic and you can see i have this correlate tab i've already pre-built this query but i'll walk you through it and i'll explain why this is red so it does syntax validation for me and so you can query any index pattern that you want and so in this case i need to include the results of operator which is its own index so if as soon as i add that in there and then i can correlate and i'm gonna i'm gonna narrow this down a bit more because i only care about the data coming from elastic agent which is under this logs index and we
can leave that signals index in there as well and i hit save so now my query is essentially looking i'm going to look for a sequence of events where i have a process running by a certain process id i'm going to match that with the data coming from operator by its process id so technically i should see for every ttp that was around an operator if i've collected everything i should see a corresponding process and you can see and these are the results of a sequence so the difference in color is basically where every time there was a sequence match so this is the first match in the sequence this is another match and you
can see i have 10 because i had five ttps which means i had two logs per ttp which is exactly what i want to see so you can see here i have um the the log that we collected so you can see um terminated process command prompt that ran these arguments so let's let's say at once the firewall show all profiles and then i have another one here this doesn't have row rendering it looks blank but it actually has data so if we just expand this video to see and what this is going to show me is the log from operator where the pit matched that's really cool right because now i can see um
the the response that the red team got without having to go to the red team so that full feedback loop is right within the blue teaming eyes as well so both sides of the house get it and i can see exactly what operator ran and i've matched it to the corresponding long that i got and this is thanks to eql because we can do that correlation based off of the process id you can see here even though they're different fields we can still do that um which is quite nice so here i'm querying for any process and here i'm looking for any ttp and i'm just matching based off of the process id so you can do stuff like that as well we
have too much time left so um what i'd like to like to do is now how we can show how we can provide this back to the business so so far we've looked at everything graphical and we've looked at the blue team and the red team and how what they can do and what the blue team can detect and everything that we can run which is great but what about the business right so what we can do is we can create really good visual graphics as well so here i have something called canvas and you can see i've already included sort of the raw data coming from operator but if i wanted to i can include a chart
here or like a performance metric so we have here um a really easy way of building those in elastic code lens so if i wanted to do some sort of drag and drop visualizations and i can do that and add them to that canvas workpad i think i have a pre-prepared one here so i'll just load up onto the screen there we go so you can see here i have for example i'm doing that same query as before so i'm looking for things coming out of operator and i'm doing a correlation but this time in the form of a chart so i'm doing sort of the the top um what are the hosts that we're running
the emulation on and we're listing we can see we have that one host in green here james honey put an endpoint windows demo uh we have the processes which are being run as a result of the emulation plan so you can see certitude rayok which is ransomware we have msi exec come on from go ransomwindows then we have the detections so you can see top value of signal rule name so so far we've noticed that we had two detections and all the emulations we've ran today which is not good we should probably figure out our coverage but you can see this provides me the percentages of everything and then i can just grab this and add it to our
canvas work pad and then have this being presented live to whoever needs it so this is all live data right so i think that's all i have time for today i'm just going to go back to my very last slide here and hopefully you enjoyed that and hopefully you enjoyed the whole besides event and what stuff to come and if you have any questions please feel free to reach out to us on our community slack or discuss forums and have a great day and stay safe thank you all very much
Related talks
 32:36
32:36 37:13
37:13 16:00
16:00 34:30
34:30 10:23:09
 6:20:25