Automating Event Log Production & Testing for SIEM Detection
Show original YouTube description
Show transcript [en]
cool my name is Alison today imma be talking to you about automating event log production and testing for detection purposes or at the very least trying to make it a little less of a pain in the ass a little bit about me I work in fire labs on detection for a product that we call the threat analytics platform if you're not familiar with it it's fires cloud sim offering it's currently being coagulated into the greater helix platform so the name is subject to change but going forward if I say tap I so I mean I'm not referring to something like a network tab so this is a marketing talk I'm not gonna be talking about tap this is general like boots on
ground making analyst lives easier just a little bit about my day to day just to give you a little color so why this stuff became important in the impetus for some of these things the book of what I do is create detection for event data and when I say detects unicum anything from signatures to analytics modules to generally just analysts experience within the product itself so making the investigation experience better or alert triage or anything like that and when I say event data that can be literally anything a customer can send to us post based data Windows Unix Linux Network data across the board application data so it's like somebody's sending us their even internal
application data or something like a single sign-on platform cloud event logs mostly work with things like AWS done a little bit with industrial control systems data so we've done you know about everything under the Sun if you can imagine it we've probably touched at some point the other piece of what I do the less the more informal piece of what I do is develop tools for our team to keep our collective heads from exploding because when you're working with thousands and thousands of event logs or a bunch of customers you need all kinds of internal tooling just to make your lives easier anything from our test tooling to data validation stuff to a couple of tools I'm gonna be talking to
you guys about today that we're going to be releasing a little bit of background on our team so we create detection for wide variety customers so any new tap or helix instance that gets deployed gets our entire rule set which means that we have the stage generic as possible because we don't in 99% of cases we don't have the luxury of knowing what a customer's network is going to look like beforehand when they start dumping event logs into our platform which means we have to stay as generic as possible and cover as many use cases as we can and we can't be very specific because it needs to apply it like I said to as many customers as
possible but there also means is we have to have a really robust quality control setup at the core of that that means unit testing for every single rule we put out I'm going to talk a little bit more about our quality control here in a second but the this is really the like the core of why this talk was important at least to me because when we go to create a rule I have to be confident the rules gonna hit on what I think it's gonna hit on which means we need to be able to generate events that represent what it would look like in real life I'm gonna hit on this quickly just because
talking some other people I think some of things we do internally might apply to other people's situations since we work for a vendor and building a rule set for a bunch of different customers may not necessarily apply to everybody since we're kind of a unique use case but if anything in here looks interesting you wanna learn more about just come up and ask one of us there's a bunch of our team members here when you talk a little bit about it more we run our content development basically like a small software development shop and what I mean by that is we use git for version control for all of our rules and we use a simple topic branching methodology so
any new rule that we want to get at in the rule set goes into it's a topic branch and gets put in a github pull request and we have a standard template for pull requests that includes three different things validation of the data unit testing for every single rule that could set it in and then historical checks so a validation is important one because we store store all the rules in JSON format it's a bunch of rule metadata and then the query string which is the actual signature itself is stored in there as well but one is a valid JSON to do these metadata fields make sense we do some calculation between different fields that we can do automatically and
I have humans do that second piece like I mentioned which is a really important piece is testing anytime we want to introduce a new rule under the rule set it has to have at least one positive tests and with it which at bare minimum says I know this rule is gonna match on what it's supposed to be matching are what I'm intending it to match on that third thing is a historical check since we were gonna sim and we have the luxury of being able to query since we're in the cloud as well we had the luxury recording across our entire customer set to say okay for for X number of retention days for each customer we can
say I'm confident that this rule is going to not be false positive wrong because our query language is like 99% of parody with our rule language I'm confident it's not gonna be false positive prone if it does have hits their true positives and even if it does have some false positives I think it's an acceptable level to push it out so all customers can take advantage of it all I gets put into a pull request template everything is peer reviewed and since it since it's formatted in this nice template a human can go through and look at it I say okay all the data validate all the tests pass the check looks good we can merge the send the
master and then when we go to publish a rule we automatically revalidate the entire rule set and do a full unit test for the entire rule set before things go out so it can have a double layer protection there which lets us publish basically on-demand anytime we want and be confident that any rule push out it's not going to be an issue just to talk a little bit about our pipeline and this is a super-high level representation the pipeline because I want appointment point out one particular thing here log sender which we call communication broker customer sends logs to the log sender this goes to a log receiver in the cloud and then gets put into what we
call our ingestion pipeline and what's in parentheses there is what's important our rules get applied here and then they get stored in the backend and the reason why I want to point that out is a tip I have for you if you have control of your ingestion pipeline and where you can apply detection if you have the luxury of that particular case apply your rules during ingestion because you can do one particular thing it's extremely useful later on any rules that match you can then apply the rule metadata as data in their raw bin itself so then I'm gonna get stored in the backend and becomes searchable in your simra log source platform or whatever it is that way you
want to say ok I want to see all these events that match on a rule you have to go to a separate alert database to see that because the ruled metadata is actually in the raw event and that's become more important when I talked about something else later down the line so the overall problem is generating an event logs for detection scenarios is just manually intensive and kind of annoying for a multitude of reasons getting logs from one place to another is kind of pain is recreating attack scenarios is necessarily trivial especially with things like Windows host logs which I'm going to talk a little bit more in a bit analysts having to maintain their own
VMs there are logs and if infrastructure you know package configurations all kinds of things and there's a number of ways you can solve this problem you get apply to have off sprints opposed to this things like configuration management and being deployment with things like vagrant we chose to take a little bit of a different route and kind of centralized these things as services that any analyst because you could use it so they don't have to run these things on their local boxes so my focus today is going to be on network event data and Windows host data I mentioned a bunch of other data sources before and they all have their own unique problems and generating test events and getting
them places especially things like something like cloud logs getting cloud trail logs out of a TBS into a sim parsed and creating section scenarios has its own challenges but these are the two things I'm going to be talking about today starting with event logs so the advice I have for you here is that Broz your friend fewer at security in Econ yesterday or even at some of the other talks today you've probably heard a lot about bro super easy to set up in parse supports a ton of different data types and even if you're not using it in production even if you just have something like a proxy just sending Network logs into and your sim or even
just firewall logs I still recommend you use bro for generating your test data because I guarantee if you especially if you just have something like a proxy it's gonna have a bunch more data than your proxy is and you can always normalize that data in the backend so let's say you have a really simple proxy set up you just have method domain URI port and that was it so if you generate your test data and grow as long as the URI field matches up to the URI field and your proxy logs it doesn't really matter that generated and bro not you can always normalize that with parsing and I say that like you can just parse it I mean
that's sort of and parsing is its own complete challenge and outside of the scope of this talk and me saying just parse stuff is kind of like saying in order to win just don't lose it has all of its own challenges but as long as you do have at least decent parsing in those field matches uh those fields match up it doesn't really matter if you're using bro or not so in this particular case I'm suggesting you use bro now you could have every analyst run bro on their own box which like I said before presents its own challenges with configuration management if you have a bunch of analysts generating bro data to talk do all their configs with the same
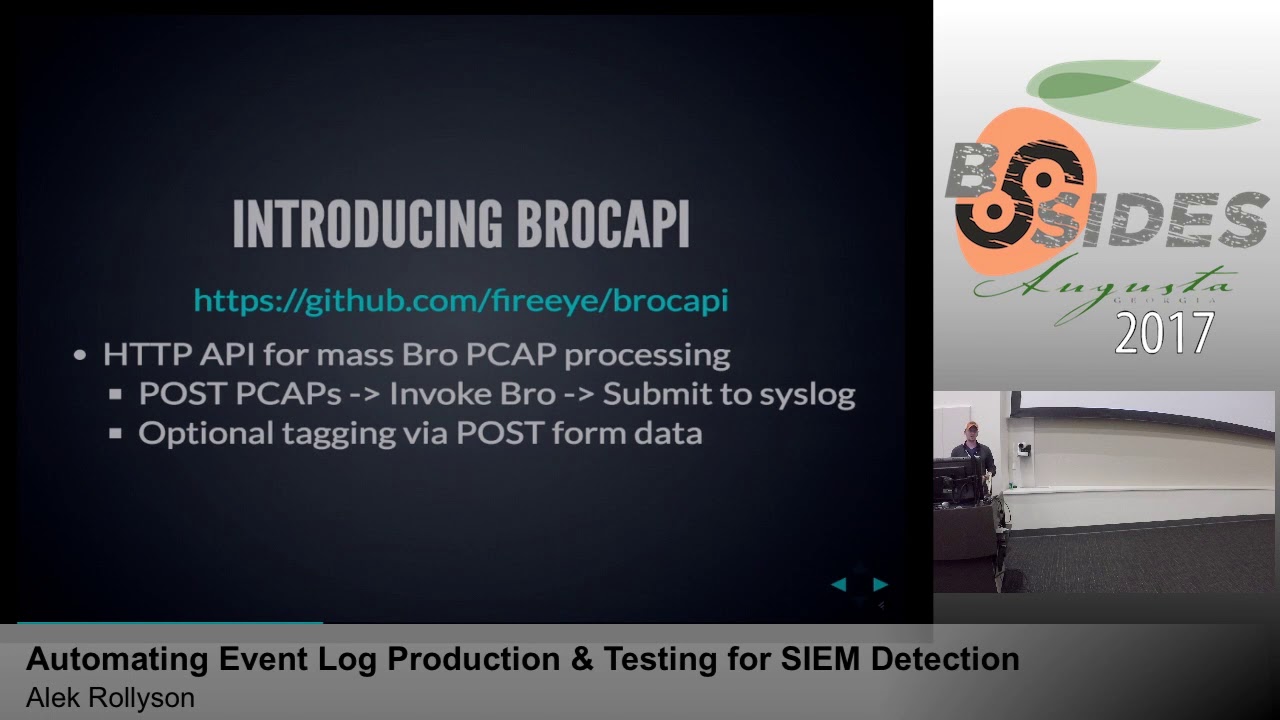
are they generating data that's going to be consistent so when they go to create detection they would end up with the same sort of result or this is why we wrote this tool so we like to call bro copy it's a portmanteau of bro pcap and API I included a github link up there which isn't live at the moment it'll hopefully be live in the next couple of days some internal things that just need to happen before it gets posted but basically what it is is it's an HTTP REST API from massive bro pcap processing and tagging and the tagging thing is the important here so at a high level what you can do is you can take a bunch of pcaps
let's say you have a dozen pcaps from a particular our family you can submit those with a post request - bro copy with a particular tag or whatever you want to call it it then takes all those p caps in runs bro against some stores all the logs locally and submits them to a configured syslog server so you can go from one post request to logs in your sim and one step and that's it just to talk a little bit about the internals of bro copy that I'm not going to go too deep into this because it becomes a web app development talk there's two pieces to it there's the HTTP API on the front end
and all this is written in Python it's a flask out with one route cement pcaps you post pcaps to it at queues jobs and Redis and then the second piece of real copy which we creatively called broke happy worker is just a worker queue using a Python module called Redis queue it takes all the submitted key caps through bro runs them through bro stores logs locally submits them to a syslog server there's a bunch of ways you can deploy this and it scales really well and this is kind of overkill for a simple like just get peak apps in your sim situation but if you have hundreds and hundreds of peak apps or thousands and thousands of
peak apps like what you sometimes do the scale is really well across the board because you can deploy it as a WSGI out for the API and then for the worker you can run as many workers as you want we use just as a daemon or a process control daemon called supervisor D and you can run as many like I said because they're independent like discrete workers you can run as many as you want horizontally I include configurations in the repository for all this there's a unicorn which is just a WSGI worker configuration system d service files for all this a supervisor di and I file for running the broke a pea worker so all
that's in the repository and there if you want to look at deployment in like a more consistent manner so here's a what a request would look like using curl you have a peak app called food out peak app and I want to tag this with the tag evil so you post it to Brooke happy with the file and then in the form date I would tag e equals evil and that JSON blob at the bottom is a return that you would get makuta job here's the files you gave me here's the tag you gave me here's the job you UID so when the worker runs this is how it stores it on local disk so you have the
overall configured jobs directory then underneath that you're going to a bunch of folders that are named after the job you you IDs and underneath that you have two folders logs for the logs stored locally and then pcaps for all the piec apps that you gave it and so when I say tagging this is what I mean and what it's doing so the first line there is it's a slog header you've got the syslog priority number a timestamp and the highlighted piece is your tag normally what this is is the syslog post name field and since this is test data and it's not coming from an actual system it's a peek app that you submitted we
don't really care what the syslog post name is so we can just take advantage of this and submit the tag here so for us what we parse that to is a field we call raw message hostname so if I submit a peek a pin I can then go back and say okay show me Ramos his host name equals evil and boom I've got all the logs that pcap I submitted and the reason why we did this is because it doesn't require any additional parsing you could do something like adding an additional bro field but for us since we work in like a pretty large product we wanted to take advantage of a field that was already
par so in this case it's a vestigial field anyway because we really don't care what the Siuslaw host name was now what you can do with this and my tip here is that you can further subdivide your input by appending tags to your initial tag and we do this on client side so like a use case here would be say you've got X number of PCAST from some our family but it's a bunch of different variants and you want to be able to say yes I want to I want to tag all these with this Maur family but I want to be able to tell which pcap is which so like we have some client-side
scripts because I haven't released because they're a bunch of like internal idiosyncrasies related to them but really all they are just wrappers around part of the Python request module so I go in and say I want to submit them Brooke happy with the tag evil 12p caps and then what the client does is it just up ends like for us it's like a six six letter hexadecimal value and then submits it so when I go in and I can say okay this is evil - 1 or evil - 2 or evil - 3 and so it's all subdivided by the P caps that you gave it and this is especially useful if you have the
capability to prefix searching and your log store a storage platform so if I want to see an individual pcap I can go a ShowMe rama's host name evil - 1 or if I want to see all of them and look at them all at the same time and set it by an individual PK basis I just show me wrong with each host name evil star and it'll give you all the P caps you submit and not just like granular by one so this is a bunch of different use cases for us quick detection verification so even if it's us or another team or a sales engineer comes to us and they say hey I got this P cap of this malware do
we detect this like well I just post the P cap to this API it'll show up in our test helix instance and it's either going to match something it's not so it's a quick way one post requests logs come in detection matches against it shows up we can search it and that's all that we had to do gives you rock reliable and reproducible test production because you're doing it all in one place since your analysts are using the same API with the same broken figuration you're gonna get the same result every single time and because it has you can give it a unique input which is then tagged on the output you can use as a building block
and further automation so like a use case here would be scraped a bunch of PCAST from an RSS feeds say like malware traffic analysis net automatically post some water broke happy with some kind of derived tag it stores in the backend then whatever your automatic job is can go and search for those results and do things like build reports so you can automatically just point it at your RSS feed and every time a pcap comes in what logs do we see or what logs is broke let out do we have any detection on this and this is why the ingestion detection what I talked about earlier is kind of important because if you have it as
searchable metadata you don't have to go calling on another alert database to say okay is this login alert it's all just metadata there and the raw in itself and even more useful than that you can you can say okay what out of this pcap didn't match anything so you can do the reverse whereas if it was all stored in an alert database you'd say okay here's the logs on alert database now you have to do it diff against what's actually what all actually came in so we've done that automated away some of the pain points for network logs let's do the same thing when des looks so post logs in general just more of a pain they
require more initial setup for bro I mean you just app kit or you'll install bro and run peak apps through and boom you got logs with a with Windows logs you have to actually set up a VM set up some kind of log forwarding configuration you have a bunch of group policy settings to get all the log event logs that you want or installing system on or something like that just generally a lot more overhead and maintaining and there's a lot more options for configuration and delivery just my two cents on the host configuration itself I mentioned cess long before and I'm kind of beating a dead horse at this point but this one is great in the same
reason that bro is great it gives you a ton of data and again even if you're not using it internally if you're just relying on like 40 Levin ID 46 88 process execution events even if you're generating system all in part of your test events as long as the image field from a system own event maps to the you know process field for 40 688 events it doesn't really matter what was generating it as long as the parsing matches up I suggest to use NX logs ascender for a very specific reason that I'm going to talk about in a slide or two but other than that they got a free Community Edition it's easy to set up it
basically just works it's easy to configure the third piece to send your logs in JSON format and a lot of cases especially with Windows events you're going to get a little bit higher velocity and things you might not see and tab-delimited just normal syslog events and the other reason is you're not a parsing masochist nobody loves parsing tab-delimited syslog fields it just sucks and nobody's really gonna turn down pre-sterilized theta so let's automate some of this away using kuku so we wrote this module that we like to call tag host and what it is is the windows auxilary module that it requires NX log to be installed which is why I mentioned it a second ago
and what its gonna do is it's got a dummy valuable or variable in the system or in the annex log config so it's going to take a predetermined tag same way bro copy did so you're gonna say okay run this analysis this is the tag that I want to come from the event logs it's going to rewrite the dummy variable in the annex log config with whatever tag you provided it restart NX log and now what happens is any new event coming out of that system is going to have a host name of whatever the tag it was you gave it so this way you can run a sample and cuckoo give it a tag if you have event
forwarding set up out of your out of your cuckoo guests they'll automatically send it to whatever sender you configured it to and if you have that automatically going under in your sim you're gonna have tagged by hostname for each and houses wrong so here's an example of just a simple API request it looks identical to the Libero copy one your file just called file and then the way this works with tag hosts is cuckoo has what's called an options field for every analysis run and so what it's going to look for is this tag underscore host key and the value they give it is going to be whatever tag you want to your analysis from to be
tagged with and so for us the host name field Cummings and comes in and windows logs this parcel field just called host name so if I tag it with the tag evil and I want to go in and say okay show me all the logs from this analysis wrong you say host name equals evil and boom I've got all the windows logs from that particular cuckoo run the use cases here basically the same as where Kathy quick detection verification you can go from sample to Windows without logs in your sim quickly reproducible real-life reproducible and reliable test production because these analyst isn't running their own Windows VM with the log forwarding setup you just set up a
bunch of VMS and cuckoo with this they can boom they can get it back logs out and building block for further automation the same way with Brooke Kathy get a feed of samples coming in can tag them run through stored in your sim since you control the tag and it's tagged on output you can automatically search for that and do all kinds of whatever you want to do after that there's a quick tip here let's say you have a bunch of commands for like an iReport so attacker got in the box and ran these twelve commands could spin up spin up a VM and remain only run these all themselves or run all these commands
themselves or toss them on a batch script and throw them a cuckoo it's going to go through sq the batch strip run into those commands in sequence and you're gonna get event logs just like somebody was on the Box round those commands themselves so aside from the tools we released today how else do we make our lives easier by sharing so this is in the works this isn't being released yet that we're working towards a release just going through some internal processes to figure out the best way to so for our team we've wrote a ton of what we call windows methodology rules and basically it's just like general windows behavior from all over the board
if it's like you know process relationships like this is an event log from when PowerShell gets called from an office process or when someone deletes prefetched sheet down to like things like just normal operational behavior like adding someone to an act like a privilege group or you know anything you can think of so anything that we had a public reference for if it was based on a blog but based on a tweet or based on a presentation we include all that as metadata and our rules so what I wanted to do was take all of these and basically publish the test events for them not the rules but so what and what I think we should build is this public
reference of what a Windows Event log looks like when something happens so you've got things like ultimate Windows security which is like basically lays out what each of NID looks like but there's nowhere to say okay I just here's the test data I can spit this into my sim it's you know a recreation of what it would look like in production basically you'd have to go and do it yourself so there's no reason if especially for things like operational stuff is like okay what it was the actual Windows Event look like for you know a failed login to a non-existent account so there's no reason we can share that kind of things especially if like a bunch of
us are reproducing the same stuff so what we've done is basically taken all those positive tests and organized in my directory and the directories of topic directories whether it be like lateral movement or privilege escalation or you know PowerShell related things or process relationships basically just building this corpus of you know example windows events and like I said I'm still working on getting this published hopefully I'll have something in the next week it probably will end up on the fireEye github as well if it doesn't we'll figure out somewhere else for it to live when it does come out we're gonna hopefully continue releasing things as we find them if we see tweets it's like okay that's interesting if
John Lambert tweets out you know maybe you guys should be watching for long at the path directories okay well we'll create a witness for that stick it add it as a positive test for whatever a rule map we might create and then since it's based on public reference information just publish it to the public github this is just an example of some of the stuff that would be released in this there's about a hundred of them right now I probably can go through and find a bunch of other ones for like but don't necessarily have public references right now but I'm sure they exist yeah thanks to all these guys these guys either worked on our team at one point or still
work on our team and either generated some of those reference events I was just talking about or helped me get to develop some of the tools I was talking about earlier so yeah thank you these guys most of which I think are here at the conference except for Patrick so with that my slides are at this link they're just HTML so it works straight out the side or you can just clone them a repo or ask me questions or whatever so with that I guess have any questions
Related talks
 43:49
43:49 45:10
45:10 30:34
30:34 29:07
29:07 1:20:35
 25:18
25:18