The Fault in Our Metrics: Rethinking How We Measure Detection & Response

Show original YouTube description
Show transcript [en]
theault our rethinking how we measure detection and response thank you hey all thanks for coming to my talk uh I've worked in detection and response for the last decade and I've made a lot of mistakes uh especially when it comes to metric uh this is the talk I wish I had seen today you'll get three things a framework I built to help you build much better metrics a new maturity model that I've been using to describe and measure detection response capabilities and lots of examples and my story with metric starts on a Monday morning I'm only a few months into a new job and I get a message from my boss he's like the board
of directors meeting is coming up and he's looking for updated program metrics you can tell I'm new to Senior Management I don't ask any questions I'm really eager to please and so I send a message to my new team and I asked them hey what metrics have we presented in the past and what's the response bad news last manager just made those up good news I'm going to do so much better uh how many of you have had this happen where you inherit someone else's metrics mess yeah it's often our starting Place metrics that haven't been well thought out and maybe even worse fudge to to avoid questions or more work so I did what you probably did I
Googled it and then I just ended up copying the metrics I used at my last job and that's led me to using a lot of bad metrics but so what why should I care about metrics well you came to a talk about metrics why do you care about metrics your progress towards go [Music] right measuring how well you're doing are you getting there train our team and we need better ways to measure how the team is performing that's right team restructure let's see if this is actually better or not what else night is dark and full of tears right I like that yes um metrics are supposed to help us drive Improvement right Carl Pearson he's a
late 1800s 1900s guy he's widely viewed as the founder of modern statistics and he's got a quote he's famous for uh it'll be in your Google search if you write to talk about metrics uh that which is measured improves which at first sounds like a great plug for why metrics are important but there's an implied warning in that message what if you're measuring the wrong thing there's a paper written by these two guys out of MIT Hower and cats and the paper's called metrics you are what you measure and they talk about the more you pay attention to metrics you start to make decisions to improve those metrics the metrics you choose will improve and over time you'll become what
you measure metrics also help us communicate what we do and why people should care um Edward tufty who teaches uh this really great course on presenting data but nothing to do with security um it's a really fun course talks about the ways that we have failed at presenting data he's got a whole section about terrible PowerPoints which is really fun um and he's got a quote that says metrics reveal data metrics are a tool that enable us to present the greatest number of ideas in the shortest time with the least ink in the smallest space and why well it's be honest we need a budget we need a headcount and metrics are usually the tool we use to
communicate that so why are security metrics hard why are security metrics so hard feel like a lot of times you don't know how to tell the story of what's going on you lost the numbers yeah you're trying to tell a story of what's going on but you just have a bunch of of numbers yeah random data is random random data is random yes it's hard to prove a negative it's hard to prove a negative I've heard that one before right like in security we do all this work and uh it's hard to show if it did anything if the bad thing really didn't happen right away yeah metrics argu yeah B metrics arguable us yeah um
for me uh in my own personal experience security metrics are hard because I'm a security person and I don't care that much about metrics here's a much less famous quote metrics are an annoying PowerPoint I need to update every month that's me a bit about me I'm a senior staff engineer at Airbnb I work on fun things like Enterprise security threat detection and incident response and I love my job I live up in Austin with my wife and three-year-old son Liam and I love being a dad and a husband and there's one thing I'm really good at as a husband as a dad and as a security engineer I'm really good at making mistakes and this is the point of talk
where I'm supposed to gain some credibility with all of you tell you about my accolades my years of experience but really I've just been making mistakes let me tell you about five of them and the first terrible mistake I've made with metrics is losing sight of the goal how many of you uh work the alert queue or on call in in some way or fashion yes the tired people in the room um I'm on call right now actually I'm like I'm going to act them right here um uh this marks my 10e iversary of being on call and for those of us that spend our days triaging alerts and responding to fires it's really easy to
lose sight of the goal and so we end up describing that Frontline operational work with metrics like this [Music] one yeah you've seen this metric before you've probably have this metric or have had this metric in the past and here's a metric that shows the number of security alerts per month and if you take a closer look you can see that in the past year March and April had the most alerts my boss will ask a question about that and if you keep looking at it it generally looks like alerts are trending down uh did we do that uh did we stop logging something in February did I just get mad at the IPS and be like you know what these rules
suck these are all just getting turned off uh alert count has become the heartbeat metric for security operations instead of roting back to the goal of detecting threats and responding quickly we've reduced ourselves to cries for help I've come to call this metric the operational burden we've inflicted on ourselves uh another title might be uh we're doing things it's crazy out there maybe it's fear driven scare leadership with a bunch of alerts and sometimes we try to make it a bit better we break it down by true and false positives I've been proud of myself for doing this but if I'm honest I'm sure I'm not sure what I was trying to say with this metrick that we have a
lot of false positives so what's a good true to false positive ratio is it the same for every type of alert exactly would reducing false POS positives mean I'm potentially decreasing my visibility in the threats is having too many false positives causing me to miss true positives and so the first problem I'm running into is I don't know where to start with metrics detection and response come a long way uh but I'm still stuck here making metrics about alert volume so I need a starting place and so to give you a starting point I thought about what in detection resp response could we measure to help us make decisions and see if we're improving and you can remember these by
the acronym saor we want to show that we're streamlining our operations improving our efficiency and accuracy either through automation better tooling processes we want to raise awareness about what we're learning from thread Intel sharing things like threats and Trends we should be prepared for we want to measure our vigilance how prepared are we for those top threats can we detect them and as we learn about new threats and Trends how is that guiding our threat hunts as we explore our networks what are we finding and then when our detections fire or a threat hunts turn into incidents what's our Readiness how quickly are we able to organize and respond to incidents and how complete are are the
playbooks so when you're thinking about your own metrics think about which category the metric should fall under and this can help you tie it back to an outcome and I when I'm building up metrics I like to start with just one per category uh we often get asked to make a lot of metrics um and that doesn't really help us focus and generally speaking that's one of the biggest challenges in an operational role is we we're constantly going from one thing to the next and for each metric we should ask what question does this metric answer so what question were we trying to answer with this metric I think it was something around time are false
positives taking up too much of our time do I have enough time to investigate true positives and then another question you can ask is how do control this metric how do we reduce our false positives so how do we do that yeah how's that [Music] going exactly and if I map this to our saber categories it's a streamline metric right supposed to answer questions about how efficient accurate how much we're using our Automation and I have two big problems with this metric the first is that this metric actually doesn't tell us where we're spending most of our time it seems like it does and second the only control I have for this metric is tuning or turning
alerts off which is you know not always the greatest motivation so let's make it better and here's a graph of time spent on false positives and I've completely removed the true positives for now because for now I'm okay that we spend as much time as needed on the true positives but instead of tracking how many false positives there are I'm tracking how much time is being spent on them so now how much time you spend working on an alert manually you could measure that simply by the time that the alert got assigned to when it was marked as a false positive now if your team's anything like mine we have this incredibly bad habit where when we're working the alert
queue we got all the alerts there what do we do select them all assign them to ourself and why do we do that what metric makes us do that performance metric for how many how many you triage your time to triage um your slas how quickly did an alert get assigned to somebody uh this is a good reminder that uh you know we're all smart lazy people right that's why we got in this field um and so if there's a way to hack a metric we absolutely will so if we're obsessed with meantime to assigned and getting that metric down you absolutely will get it down but you might not be getting a lot of value from that so my
recommendation is at least temporarily stop measuring it and then this metric suddenly becomes a lot more accurate and then how do we control this metric trick how do I reduce the amount of time I have to spend on alert better process better processes automation maybe training turny alerts off sometimes I mean if you have an alert that you're like all right if I look at the time here uh we're spending all the time on this one alert and we don't have time for anything else maybe we do evaluate like how Val is this one but as we get more automation tools the number of events or the specific amount of time that is spent might not matter because
if I have an alert and maybe it fires all the time but I've automated it I don't ever have to look at it my opinion Let It Go all day I don't care I don't have to do anything for it if I can automate it so that it's always marked as a false positive when it needs to be a false positive fantastic and as you automate you can carry the time that you spent manually over to automated and this lets you speak to something really cool you can speak to the amount of human hours your automation efforts are saving you so now we're not just incentivized to tune our alerts turn them off we're actually incentivized to find out
where's the most manual time being spent and how do we automate it which is usually not something we're that motivated to do second mistake second mistake is using quantities that lack controls or more simply said measuring the things you can't change uh meantime to recover is a classic incident response metric also will be in your Google search and in this example you'll see that recovery was lower in September and October and then it grew in November and December but then the team pulled together we worked really hard and we got those recovery times back down or maybe this is Thanksgiving this is Christmas holidays this is New Year's uh it's funny I've spent the last
year researching metrics for detection and response and I have learned that we're obsessed with speed me tricks the vast majority of results I uh that when you look them up are about meantime meantime to detect meantime to respond meantime to contain to recover I'm certainly not going to argue that speed isn't important but when we use time as the sole measurement across incident phases we completely ignore quality and Effectiveness but my big problem with this metric is that security incidents have a lot of variability especially the further Downstream you get in the response process not all incident is the Same by far a lot of dependencies occur from event start to recovery and not all of
that can be controlled at least not by your teams and so a graph like this it doesn't help me make any decisions because it doesn't reveal what's controllable how do I get better here I don't know where to go and what happens when you have a that you can't affect you stop caring about it okay great went up and then I went down sounds good so instead I've tried breaking out the response time across the different phases and here I've done some filtering of any built-in time I know I need for either quality for the Playbook itself I know this Playbook like if I need to go isolate a machine it's going to go and
take this much time I know for certain types of scale of incident I know for this many hosts that's the multiplier and I like to do this because every response Playbook has some type of built-in time you'll need and sure as you mature your capabilities that built-in time will come down but that's not the focus for this graph here we're looking at what can we control today uh Eric brandwine uh he gives this really great talk he's from AWS the talk is called the tension between absolutes and ambiguity in security uh it's on YouTube Eric brand wine tension between absolutes and ambiguity and security and in it he says when you look at a metric
it should immediately answer what do you want from me what do you want me to do and one of the easiest ways to do that is to make the answer zero if there's nothing to do here I filtered out all the time I can't reduce right now and if there's nothing to do I've made the answer zero the other nice thing with this is you can actually present a large amount of metrics on a single dashboard when you filter out and make it zero because your eye will immediately just okay great nothing to do nothing to do oh something to
do so now when I look at this metric I go okay we're struggling somewhere in the remediate phase for these incidents what do I need to filter out here and what can I actually improve today and then you can make your metrics actionable all right mistake number three thinking proxy metrics are bad or more simply choosing amazing metrics that are insanely expensive to create when all you really needed was a correlating metric that was good enough here's a great example uh so a long time ago my team and I decided that we wanted to know what our miter attack coverage was and this was before this was like the really cool cool thing to do uh and
we determined to do this we were going to have to write tests across the entire framework and then once we got going we figured out that well one test per technique probably won't tell us much and then we've also got Windows and Mac and Linux so we're going to need tests for all of those and so after years of developing tests investing in tooling we finally had the data we needed to visualize or attack detection coverage uh side note I saw a really great tweet the other day it said we need to do a better job of mocking vendors that claim 100% miter attack coverage for many reasons obviously but most importantly uh I've seen the car AG of
100% coverage and it's alert fatigue like you wouldn't believe anyway we spent years Gathering all this data and it's really cool but at the end of the day all we really wanted to know was where do we prioritize our detection building so do this instead rather than trying to measure your detection coverage across the entire attack Matrix start by finding the top five threats you care about the most and don't over think it look at your external thread Intel think about what industry you're working in what type of environment you have and then look internally your incident Trends what types of incidents are reoccurring and then link those back to your organization's security risks what would be a really bad day for your
company if data was exfiltrated what data would make your Chief privacy officer cry the most it's a great metric by the way you can do like sizes of tear really eye-catching and then once you've got your top five prioritize your detection development from there and I like to Workshop these as a team we all kind of split up the top five threats and then we'll use attack to derive all the different techniques and sub techniques and as you write your tests and detections you'll slowly end up building yourself a prioritized miter attack coverage map but without all the alert f and a super upfront costly metric and plus the metric of how close you are of
best friends your Chief privacy officer has moved as well all right mistake number four not adjusting to the altitude uh and as someone who has floated back and forth between management and individual contributor I'm very guilty of this one um who here has ever tried to explain all the different different phases of the miter attack framework to a board of directors yeah I have sure why not uh I think detection coverage is actually one of our better new metrics but wow we have done a bad job at explaining it at the leadership level uh I've seen one of those miter attack heat Maps generated from a specific vendor just slapped into a board of directors deck as if it mean
means anything to them so we need metrics at every altitude and the higher the altitude the less it will be about the detection and response technology itself and much more about how it impacts the business it's helpful for me to think about it like a pyramid um for the business the impact we make is reducing the cost of an incident or breach or another way to think about it might be making it more costly for an haacker to cause impact and so our metrics at the top of our pyramid our Northstar metrics are about how quickly we can alert the organization to a threat and how quickly we can get things to business back as
usual but then under that top layer we can talk about coverage and Effectiveness can we detect those top threats to the business do we have playbooks for the attacks most likely to happen do we have the visibility we need and then under that layer how well do your tools perform how much time do you spend trying to figure out what logs you need to search and then how long it takes you to search them and organizing your metrics in a pyramid can help you connect those lower level layers to your Northstar metrics and speak at an altitude that's appropriate for your audience uh organizing them in a pyramid can also help you connect your metrics
with the rest of the security organization uh turns out detection and response is not always the best strategy if your metrics show that meantime to respond is trending up because of a reoccurring type of incident Sometimes the best way to reduce that cost isn't by improving your streamlined or your Readiness metrics it's getting your prevention teams to put a new control in place to prevent that incident from occurring and when you have metrics that you can essentially tell that story of hey this is going up and this is how much it costs for us to bring that down maybe we should think about prioritizing this from a prevention standpoint and plugging that into the rest of the
organization mistake number five is asking why instead of how and my natural Inc Foundation is to ask why why didn't we detect the malware sooner why are we still missing firewall logs and as a dad I have a lot of why [Music] questions why did we bring the car seat when we only took one taxi ride the whole trip why do we need four suitcases why didn't we bring the stroller why can't Liam walk by himself such a little boss here uh and in all of these examples why is not helping so instead I've learned to move straight to the how and start figuring out what actually needs to be done because often answering how allows
you to identify the underlying problem much faster and from a much more positive perspective especially from your spouse I mean cooworker how can I carry Liam a car seat and at least two suitcases through the air report how can I detect these types of threats sooner how can we respond faster when I interview with my current VP she asked me how do you build a modern detection and response program how do we get there it was like one question interview how do we describe where we are today and where we're going and it made me think about maturity models and my first exposure to maturity models was the hunting maturity model does Ed anyone not familiar with
the hunting maturity model yeah so the hunting maturity model uh you know it's been around I think like 2015 2014 but essentially it was a way to describe different levels of maturity for doing threat hunting speaking to you're at a level where you have basic ioc's and you're searching for them to I'm using Advanced Data analysis to find things that are unknown in my networks and it was really helpful because when I could when I would speak to an organization I could we could we could have a conversation about what their maturity of threat hunting was and it gave me an idea of like okay where are we today with threat hunting it gave us
as security practition uh practitioners this common language to answer where are we now what tools and processes do we have what's the current situation what are the challenges and where are we going where do we want to be by next year and how are we getting there how are we going to achieve them so as an extension to the threat hunting to the hunting maturity model I created the threat detection and response maturity model and the TDR maturity model builds off of the hunting maturity model and expands it across all the different areas of detection and response and there's a lot to it so at the end there's a link to the full maturity model that you can use and and
the first pillar I thought about when measuring maturity was observability or having the tools and logs that give us visibility into our entities and user activity and enriching it so we can contextualize the data and search it quickly and then proactive threat detection where we focus on collecting threat Intel so we can prioritize the detections that we build and buy and the Hunts we perform and then rapid response where we prepare with playbooks and Auto ations so we can move from triage to analysis and respond with all the capabilities we need and we can use these pillars and these 14 capabilities to describe and measure where we are today and where we want to go next and
for each of the 14 capabilities in the framework you'll score four different areas process tools documentation and testing and you'll rate those from initial all the way up to Leading and in the slide deck I've provided just General guidance but the framework itself has a lot more specific direction for each capability so for example if we were to rate our detection engine capability we can think about the processes we have do we have a process for creating a detection that looks for firsttime occurrences do we have a process that defines the most optimal way to determine thresholds and then we rate our tools are the detections we have managed from a central location and then
documentation what's been the case for most of my career the lack thereof and then finally testing how do you validate that our logic to determine firsttime occurrences is actually working and as you go through each of the capabilities I like to rate them individually and then get together as a team and rate them as a team exercise because once you get everyone talking about the different capabilities you'll hear things that'll change your mind or confirm your own rating and then once you've rated all of your capabilities you can visualize it and here's an example of how you can take those ratings and show at a high level where you are today across the three pillars and where you plan to be by some
endpoint say end of year based on the projects you're planning and your initiatives and I really like using this tool because at a leadership level it's a very simple message but you have a lot of underlying detail that you can go into but I also really like it because it shows whether the work you're doing has an impact on your maturity so if you planned a bunch of projects and work for the year and you do this exercise and the bars don't move maybe you're not doing the right projects and this is a great way to show that and then as you do that work you'll need metric to show that you're getting better and so this is where saber comes
back in again and for each metric you create you'll put it into this structure here you want to avoid my mistake number one losing sight of the goal and ask what question does this metric answer what outcome are we looking to achieve and then use those categories to help tie it back to your outcome and North Stars and you want to avoid my mistake number two having metrics that you can't control don't forget to make it zero as well filter out what you can control today so that when you look at a metric you know exactly what it's telling you to do and then if you have control of a metric what risks could this measurement
reward so I was talking to a buddy of mine and he runs one of those like really big socks the kind with the big monitors around the room and I'll let you know that the pew pew map is still alive and well I haven't been in one in a while but pew pew rains on if you don't know what I'm talking about you look up pew pew map it's beautiful anyway we're talking about metrics and he was talking about his team's uh time to analyze metric it was a really big pain point of this sock overall analysis was taking way longer than they expected so they brought the metric up to the team hey time to
analyze let's find ways to bring that time down so you won't believe it the team brought the time down but guess what else went down quality so guess what what up true positives missed so when you introduce a new metric think about what potential potential risky Behavior could this new metric be rewarding it might not be a bad metric but you want to create other metrics that'll balance it out because remember you'll become what you measure then metric expiration when is this metric not needed anymore when our only lever was alert tuning it might have made more sense for us to track alert volume but now as we move toward much more automation tools maybe it's
time we expire our alert count metrics or at least remove them from our leadership decks and then data requirements how much data will this metric require how much new effort are we going to need to improve the metric because um you can make as many and this is why I argue like please just make one metric for each it doesn't matter how many metrics you make you don't get new people to uh you know work on improving those metrics you can create metrics your blue in the face and you're like okay great but like what am I focused on here you want to avoid my mistake of trying to test across the entire attack framework right you might not need to
think about what's what am I actually trying to get to and then do the laziest thing possible and anytime I talk about metrics I always get asked but how do I change the bad metrics I'm already presenting today and I get it change is hard leadership doesn't like surprises and they often have expectations that you'll be updating last month's slide deck but I have a tip that's worked really well for me um here I've convinced my friend Dexter still my friend to get in near freezing water this is like 4 Cel 40 F he's suffering right now um my son is absolutely loving it too he thinks this is the best and when you jump in it he's
immediately like splashing you because you're just in pain and when Dexter got in here his first reaction was shock his heart rate spiked when he hit the B water he gasped he had to try not to hyperventilate but then suddenly about like a minute and 20 seconds Clarity and it's the same when you change your metrics it's not going to be fun immediately people will go into a State of Shock especially if they've been in those nice cozy warm metrics for a long time they've gotten used to them but my tip is to embrace it push through the change and they soon will have Clarity around what you're actually delivering so let's bring all the
metrics together and up front and center is our maturity model model using the TDR maturity model and we use the sa categories to tell the story of our program and I don't get very long when I present this so it's a short story we're streamlining our efforts our operations to look at what's taking the most time that's where we're focusing our automation we looked at our thread Intel and incident Trends and we're raising awareness about these top five threats to the company and we're focusing our time this quarter to build detections for these threats here's where we're tracking we've been exploring gaps in our security controls relevant to those top five threats we found three new gaps
and from a Readiness perspective we have one type of reoccurring incident with a really long recovery time so we're working with our Enterprise security team to implement new controls that'll prevent these incidents from occurring so now instead of making wild guesses about whether you're improving and if the tools you're buying are making a difference you have a maturity model to measure your capabilities instead of using volume counts fear tactics and tired emojis you can use sa to get to the core of a metric ask better questions and map that to something you can control instead of focusing on 100% miter attack coverage you're focused on what threats matter the most and are working on having detection
coverage for those so you'll have real impact so hopefully this talk is your wakeup call take a cold plunge rethink your detection and response metrics thank you very
much this is my link tree it has my contact info it has a copy of this slide Deck with additional slides for context it has the complete TDR maturity model I also write a very infrequent newsletter I have a toddler so you know free time is abundant uh it has an adorable cat that people love and the security info is decent uh and I have a whole bunch of uh cute stickers that my three-year-old helped me design with the cute cat um so I've got time for maybe one or two questions so yeah let's do it all this resilience resilience yeah I think um within your both like uh is that the goal you're trying to reach yeah
all yes between like your ability to have like detection coverage across that vigilance across like the different threats you care about having awareness to know like what type of the threats are and then having that response to it and having that Readiness for being able to yeah absolutely one more question all right I got stickers come get them I'm going put them right here thanks so much everyone
Related talks
 23:14
23:14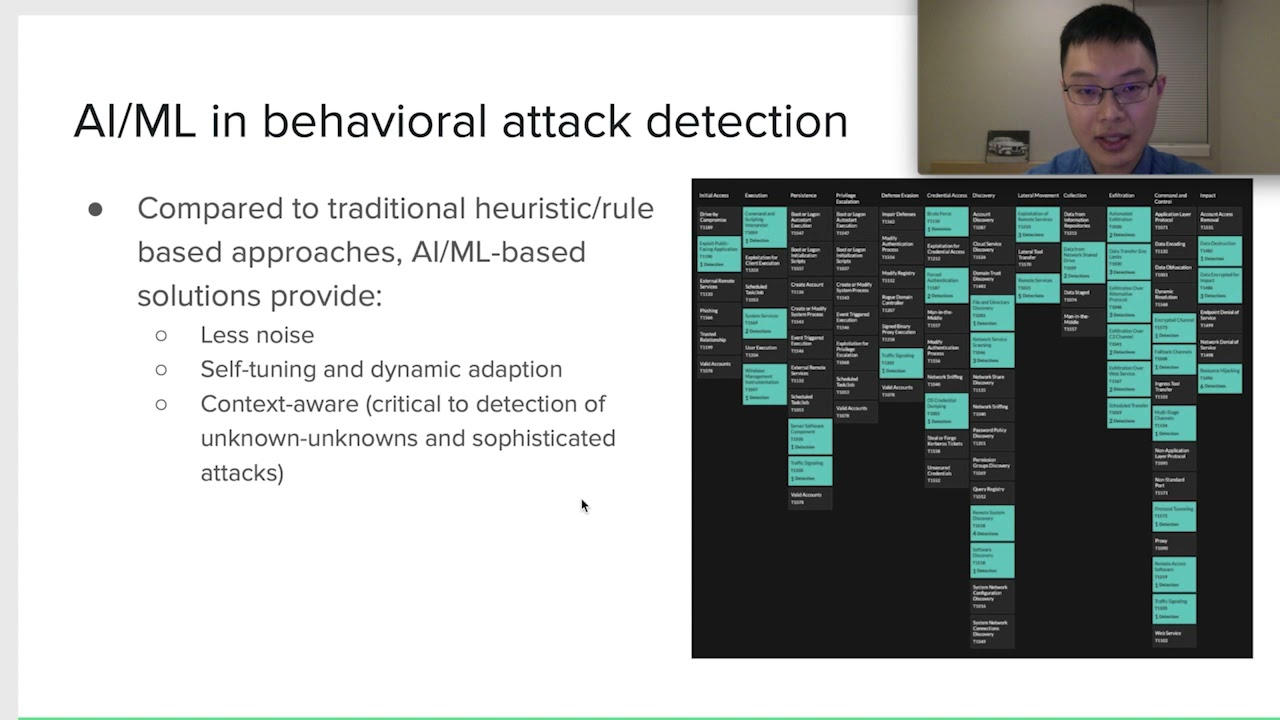 29:45
29:45 30:27
30:27 55:35
55:35 45:10
45:10 43:57
43:57