DCO and Data Science: Best Friends Forever
Show original YouTube description
Show transcript [en]
2022 our first Speaker today is Daniel lowen who is the technical director at ceiling Technologies an experience with defensive cyber operations and Engineering he's worked on programs throughout the dod specializing providing Enterprise level security hello welcome I look actually surprised how many people are here I wasn't expecting this uh this many um especially this more early so um how many people here do dco I'm gonna guess most people um do some sort of defensive cyber operations how many people do data science actually more than I was expecting a little bit um who's trained in data science like actually legit so we got two so you guys are gonna think I'm a joke um so um so I've spent most of my time doing
dco um I've had about 15 years I was originally doing uh network monitoring back in the day when like snort was cool and uh you know we were happy when we could collect like a handful of Vlogs like at 100 logs a second and we'd be like yeah this is awesome right um things have sort of changed over the time I'm not a data scientist but I kind of got put in a role where I had to learn it like I'm sure a lot of you have have done over the year um so I've have a lot more experience with doing the dco side of things so um it's a good kind of introduction to
me so the the purpose of my talk is it's really aimed at um I know some dco I know like what an attack is I know how to monitor and so forth um but I don't necessarily know data science and here's kind of my experience with learning um at the end I wanted to make it so that everything was Hands-On and that you could do it relatively easily at home so I wanted to prevent I wanted to not require like a large infrastructure in order for you to start doing data science and I'll kind of show you how you can get started it's really not that hard if you've no python it's it's pretty easy to start learning uh so
goal is not to teach you everything within an hour um because that's just not going to happen uh however my hope is that by the end of this you actually understand what's available to you and where you can start going to try to learn more that's really my my purpose and what I was aiming to do from this so we're going to talk a little bit about what machine learning is supervising unsupervised learning we're going to talk about the data science process that generally occurs throughout both of these I'm going to try to tie it back to dco at not just dco but Security in general and then I have three demos at the end we're going to use Jupiter
notebooks again they've been designed so that if you have a decently computer at home you could do it it's not like you require a ton of infrastructure to get started and also then sort of talk about how you could try to scale this afterwards so once you've learned the basics I'll give you some some tips about how how we can start scaling it so that you could actually start monitoring a much larger infrastructure um so types of machine learning uh there's when I started looking into it there was a handful of different types but these are the large broad categories so supervised unsupervised and there's another one that isn't really too much of interest to us but it's natural
language processing supervised learning is a little more mature it tend it means that you are feeding a data so each data is labeled in some way and I'll kind of go a little more in detail to that so you're spending the time up front to take objects or features was with the data Science World calls it and you're saying this is X and this is y and this is X and that's how the computer starts to learn um the problem is I'm sure you can already tell it requires somebody to teach it um so people like to try to get to results faster so the second one is unsupervised learning um and it's generally a little bit less mature but
it still has uses and that's actually what we're going to mostly be looking at uh just because it's a little easier and a little bit faster for the demos so unsupervised is basically you feed it a whole bunch of data and then it does something and it's like is this useful doesn't necessarily know that like I don't really know what I'm looking at as a computer but I've sort of categorized these and you just then have to kind of look at it and say yeah that actually is useful or no that's definitely not useful so you kind of try to push the work towards the back end as opposed to the front end natural language processing is actually
really cool and I started looking into it a lot but it's it's really a way for computers to understand written text we had a weird thing and I was able to do some really really cool things with it but it's I don't think it's super relevant to dco maybe like Insider threat type stuff but not not as relevant all right so types of supervised learning um big thing is use is for classification so my example here is If you hired a bunch of people to literally go through images all day and you knew that all your pictures were cats and dogs but you didn't know which one was which so you would hire somebody and they would say
oh look this picture is a cat this picture is a dog and they would feed it to the computer with the idea that over time it would be able to start recognizing what a cat and a dog was pretty simple there are in the industry there are a lot of different weird jobs on Mechanical Turk if you're familiar with that that is literally just doing this it's it's categorizing things you can get a job not making a whole lot of money and just sit there all day and and you just categorize things for these computers to start learning this is actually a real big problem for us because we can't usually do do Mechanical Turk especially where I work
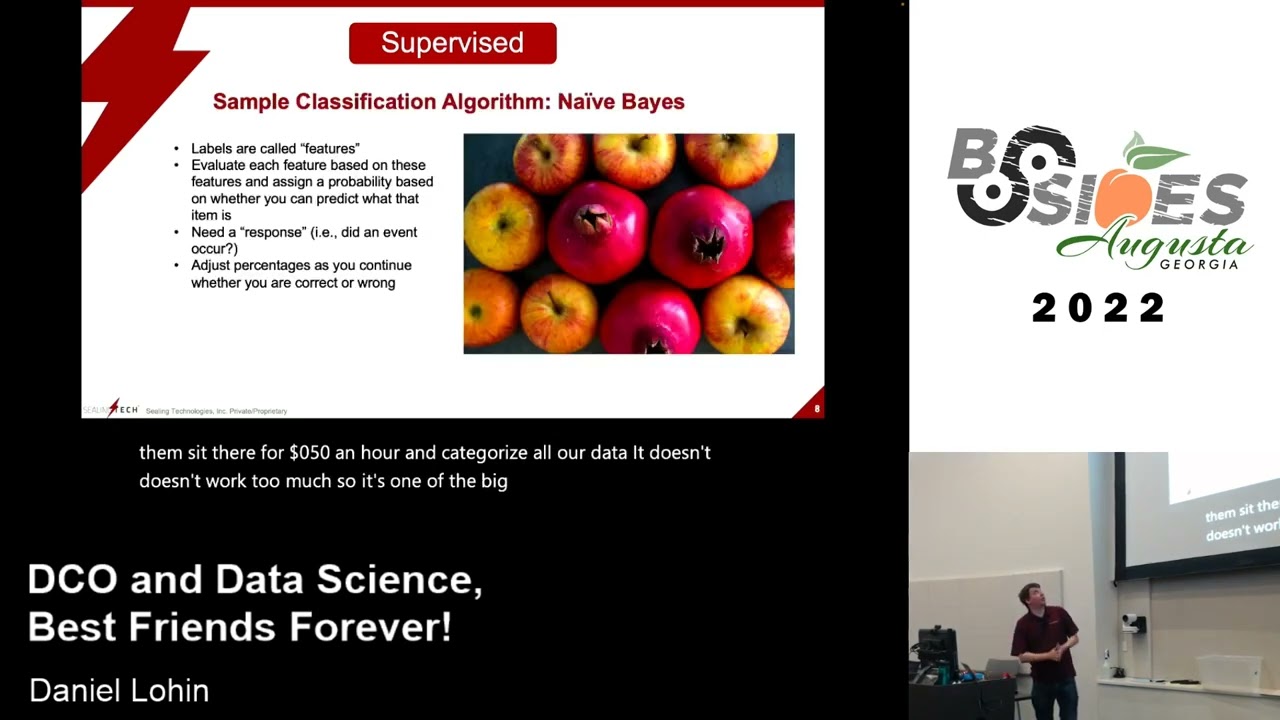
most of our customers aren't going to be like oh yeah you can just send our data to random people on Amazon and have them sit there for you know 50 cents an hour and categorize all our data it doesn't doesn't work too much so it's one of the big problems with our our field another one uh naive Bayes it's a little different in that you kind of specify what the data Science World calls features so maybe you're like looking at a feature in this picture is the color for example and maybe like the type of stem or something like that with naive Bayes you have to have some sort of response so that's like you are correct
or you are wrong or something like that it's called naive because it starts off literally just guessing so like in our case we have like I guess it's a pomegranate and an apple and you feed it the first pomegranate and it it has no idea so it just makes something up right um and then you say yes or no and then as time goes on it's slowly slowly going to get better and better and better the more data you feed it the longer you feed it the better it's going to get with time uh uh so some examples of CND some of these are very uh some examples of how this is used image detection if you've ever used
like Google Maps or apple photos it's used now heavily uh you can search like type in bird and it shows you all the birds in your photos right somebody has sat there and they have started classifying that they've gone through pictures and they have said this is a bird this is a bird this is a bird eventually the computer starts to learn these things some uses within the security realm uh probably the biggest is the one that we all hate um how many people love the click on all the crosswalks and click on all the stop signs from all the the signs the crazy thing about those is you're actually teaching cars to drive I don't know how
many people know that but the the reason that they're doing that that's a sort of free service and they're selling that data to all the car manufacturers they're trying to figure out how to make like your Tesla to drive itself and so what they're doing is they basically they know some of them but they don't know others and they don't know like they haven't categorized it and so they're having you sit there and and teach it what a stop sign is Spam detection has been around for a very long time when you click on this is Spam it goes back to Google or whoever it is and then they will say look at that message and then they will start
training an algorithm uh that that will Mark that as spam antivirus uses it I've seen a handful of products for like seam alarms relevance so hey I just keep seeing you marking this as false positive we've seen it a hundred times you know it's always been a false positive maybe we should downgrade the severity or something along those lines regression testing regression testing we've been using for a while um for aggression to work you work with continuous data of some sort which in the DCL world we generally deal with a lot of Time series data right um so this has been pretty Rel I mean we've been doing this for about 10 years now in the dco space so something simple
like how much data is coming out of a box on average right so what you do is you just say hey this system you know we get Ebbs and flows every day and we we go out and we predict what is normal and then what we say hey flag anytime that it's outside of normal it's a pretty pretty mature mature space but that is a supervised type learning so uses outside of dco and and computer network defense in general forecasting of prices Goods stocks and then uses just anything that's time series and has a value you could definitely use regression in for um all right so unsupervised learning clustering going back to our dogs and
dogs and cats example um so in this case we throw out a bunch of pictures of dogs and cats and at the end of it it just gives us two buckets and it says I don't know what these are but these seem to be related right and then somebody goes through at the end and looks at a handful of them and says oh these are dogs and these are cats um it can be a little bit faster but it generally is less accurate so but sometimes like accuracy especially when you're like looking for weird things isn't always a hundred percent needed especially if it's giving you some false positives and not too many false positives so just give me what's weird
and then I'll deal with instead of this much data now I can look at this much data and that still is of great use to us um uh one of the ones that we're actually going to look at in our example is isolation Force um so isolation Force really just is a way to detect anomalies um so you feed it a bunch of data the data can be interlinked you might not necessarily know what is like you're not saying hey this is anomalous if this happens you just feed it the data and it just says hey I see an anomaly I don't know if that's a value to you I don't know if you actually care about that but
you you know it's an anomaly that's that's all it's going to tell you um so we feed it into something called an isolation forest and it will take all our data and it will mark it as anomalous or not we say we want 20 or 10 percent of the data to be anomalous it also has an auto feature which will adjust that for you and it gives you what what it sees is anomalous and then you you comb through it and now you have 20 percent of your data instead of 100 percent um another one that's heavily used is k-means so k-means basically it takes all your data and it groups it in the Clusters so you tell it how many
clusters you want um and it gives you clusters and then says are any of these clusters of value to you and you then have to figure out if if it found anything of use um so some uses outside of CND group websites based on content would be one that I can think of uses within security sorting processes by their actions so maybe it's like what do most applications do and then group them in the Clusters and if they're outside of those clusters or maybe we have like a malicious cluster that's now bad um you could do something like sorting DNS queries into buckets using isolation Force so that that's actually my example is going to be finding DNS tunneling
using isolation Force and and k-means for for using z-clogs um Association uh so this is I have multiple pieces of data Lots like a huge data set but I don't know if they're interrelated or not I I don't know like if X and Y is there some sort of pattern that I might not recognize um the most popular one is is actually heavily used in the shopping industry so it's called I'm gonna probably say wrong a priori which means uh from what was before um this one actually made the news it's kind of a fun story it happened a while ago uh it was Target basically was using this algorithm and there was a particular Shopper who started doing a
certain set of buying habits and Target started sending the family uh things like getting ready for a newborn and um at the time she didn't know she was pregnant and her dad was very upset and she they wrote a letter to Target being like this is inappropriate why are you sending my my teenage daughter pregnancy things and then a few weeks later he sent them a sorry letter saying she is in fact pregnant so um so you just basically feeded a pile of data which is in this case these people tend to buy these things together you're not saying like you know what is the interrelations you you don't actually know and what it does is it starts
finding Interlink so people that buy candy tend to buy soda or whatever that that is um so in that they they have something called support so if people buy X do they also tend to buy y right confidence is is that always the case every time someone buys this they always buy this right so we probably want to put them on the Shelf together um and then lift is how unique is y to X so maybe people only ever buy y when they also buy X and it comes up with values and interlinks like a graph database and says these are the things that are interrelated and that's how they decide what to put on the shelves
where if you've ever worked in the retail industry you will know that you will constantly be getting things to rearrange everything on the Shelf to try to you know make us spend as much money as possible uh so uses outside of CND I already pretty much covered them pretty well um some examples of how this could be useful log on log off time so categorizing users and and trying to figure that out programs so hey these classes of users tend to run these types of programs and then looking hey why is this one user who's an accountant running a whole bunch of Powershell right um utilization of administrative functions something along those lines could be
useful all right so what am I doing on time all right so uh the next next thing I'm going to actually talk about is what is the general process for just doing data science uh it's not necessarily in Python exclusively but uh it's kind of what I'm comfortable with and most people that are doing data science is either an r or Python and people in our space tend to be more comfortable with python so I think it makes a little more sense um all right so what is the basic flow of data science in general and some people will disagree I've seen a couple of different ones but this is kind of the the general overall flow so
Gathering data so figuring out how we're going to gather all this data this is something that we have been dealing with in the dco space now for a very long time it's not really any different from what we've been doing to be quite Frank um next thing we need to do is format that data how are we going to format it we know that everyone all the log sources are all Json right generally every log source is a little different um another common problem that we have is um you know some might have like the net mask and some might have the cider or um another one is they might call fields and values different so you might have a
tool like sysmon calling it Source address and you might have another tool calling it something else so you have to figure out how to get all the data and then how to format it in some way that makes sense to you um enrich the data into features so features is really just this is what I want you to look at I don't know why they decide to call it features but you hear them saying Oh I'm going to engineer features which really just means um I have a data Sam set basically and that's a feature so something like red on an uh what what color is it red so color is the feature next we have to
figure out how to process the data and then we have to present it in some meaningful way that makes sense plus makes our managers happy and makes them feel like we're doing work um from my experience almost all the work is from gather to enrich the actually the back end stuff is actually pretty easy like isolation Force I quite frankly don't even understand how it works there's a bunch of math to it but you really just say here are my features that I've spent like a ton of time getting them into the right format push it through some like algorithm and it spits something out and you're like okay thanks that's how most of the algorithms
work what's up
I I don't know because at least for me that's the hard part like you spend a lot of time it's not easy I I don't know it is it's it's the hardest part is like getting them into the correct format and then knowing what algorithm sort of does what and then just shoving it into the algorithm and it does magic um is is the majority of what what I've done um all right so how are we Gathering data um so first we have to figure out where we're Gathering logs from in dco it's mostly network data host log data application log data there might be some sort of weird API calls especially now with like Cloud becoming a thing uh
having to pull data from from all over um and then we have to figure out is this data easy to work with like it's gotten better most is either an XML or Json these days but it used to be like like syslog messages for example or just like Rand you know just text and that that's always great to have to deal with like what do you do with that data and it's it's kind of a pain to deal with um so how are we going to pull this data if it's structured we're happy if it's unstructured we're a lot less happy but we have to figure out how to how to deal with that so next we have to turn it into some
sort of data frame um so this is what they're this is what basically is a two-dimensional Ray in the world of data science um if you've ever dealt with a two-dimensional Rays you know it's really just columns and rows in pandas they call them Series so each each row is a series um so um I I quickly learned when I first started with this um uh I found out that pandas which is the one of the bigger uh data frame libraries out there it is iterable so that means you can treat it like an array we then hired a data scientist who looked at it was like what the heck are you doing this is terrible so I learned
how to do it correctly is what I'm saying and I'll show you kind of what it is the power of the data frame is that there are a ton of built-in functions that you you can use to manipulate and extend that data very easily so you can iterate over it you can do like a for Loop over all your data just don't do it um so data frames there's as I was saying there's and I also found that not iterating is actually a whole lot faster too um if you have to pull data that is structured so for example CSV XML Json it is very easy to turn it into a data frame um I found another Library called zat on
GitHub which is Zeke analytic toolkit if you have to deal with Zeke that is absolutely awesome the other thing that's really great about it is they have a bunch of examples which help me learn so they have like a bunch of just free examples to go out and do the one we actually also use extensively for for the project you do is something called e-land Eland is for elasticsearch it allows you to connect to an elastic search cluster and it allows you to almost treat it like pandas and if you can't treat it like pandas you can press go and it will turn from all your data from elasticsearch into pandas for you and it is absolutely spectacular if you
just happen to have an elastic search cluster so I wanted to spend a little more time on on what are the types of data frames just because that's a big part of this is how we're going to organize that data pandas like I said is awesome there's tons of documentation out there there's tons of examples it is very easy to use and it's actually what I've built all my examples in just because you can do it on your computer its biggest problem is it operates completely out of memory so that means if you've got lots and lots of data eventually you're going to need a bigger box you're going to need a bigger box you're going to need a bigger box until
you can't get a bigger box anymore um so we have large boxes that have over a terabyte of ram so we can usually deal with a lot but at some point it doesn't scale you can't use multiple computers to kind of Chunk at the data to process it it's not the greatest if you have to deal with a lot it is very good if you want to explore data because it's very fast and easy and well supported another one is pi spark if anyone's ever dealt with Hadoop it is Loosely based off of Hadoop back in the day it works on something called map reduce the idea behind map reduce is you take a large
problem and you break it into multiple maps and you send it out to a cluster of a bunch of systems and then each of those systems kind of deals with their like chunk of the problem and then at the very end they bring it all back and it reduces it into a single answer at the end um uh it is uses also something called lazy evaluation so unlike normal like functional program where it's like do a do B do c you tell it I want you to do a b and c and go it does everything all in one shot um it is a little more complicated to use you need an infrastructure of some sort
but if you need to start scaling out Pi spark is a way to to go um elands as I was mentioning uh is the one where we're using extensively Eland is exclusive to elasticsearch I'm sure Splunk probably has something equivalent um but we haven't I haven't tried to use it um e-land you say here's my elasticsearch cluster um one thing that's kind of neat about it is um it lives on the elasticsearch cluster but you can treat it as pandas so a lot of the functions that pandas has that can be supported um it it supports as well so um it all the data is still on disk so when you hit go it runs out to the
cluster which is multiple systems it it does take longer because it's not coming from memory now it's coming from disk and then it gives you an answer but it looks very much like pandas there are a handful of functions that don't work in it just because elasticsearch as an infrastructure can't handle that but if for some reason you want to take data from elasticsearch and turn it into pandas it's a single function call and then it runs out grabs all the data and then you now have a pandas data frame which is really nice um all right so uh next we have to enrich the data so we have to gather value out of whatever that data is so that could
be getting all the unique fields that are out there uh counting values in a field uh calculating means modes entropy whatever that is to build our features so this is what you're looking for and you're going to feed to those different algorithms um pandas does this really easily for you a lot of the like simple math things uh that you would expect like mean medium mode you can basically say take this field and apply median to every single field in that in every single Series in that that data frame um if you've never dealt with Lambda in Python I never really under I wouldn't say I used to know how to use Lambda you have to learn Lambda Lambda in
pandas is huge um so Lambda I'll show you when we get to the um foreign when I get to actually showing off some of the code and then process so we figure out what what algorithm we're going to use and we send it through a classification regression uh unsupervised all those crazy things we talked about and then finally we're going to present the data and hopefully some meaningful manner that makes our bosses think we're doing something there's a bunch of different libraries out there plotly is pretty cool matplotlib and Seabourn are some of them and all right so um so here's my three demos um all the code is on GitHub so um you can you can just download it
today uh and start looking at it um so the first one is going to be machine learning and z-clogs we're gonna this is probably the one I I started with I was actually pretty proud because I didn't really know what I was doing this is where I started with doing the iteration and all that stuff but at the end I dumped I had a bunch of z-clogs I dumped it in I was like okay this is cool and I was like all right at the end I dumped in a known DNS tunneling thing and it popped up right away so that was pretty cool because I didn't like reverse like how can I make it find this
thing um so data analytics and Apache logs and then we'll look at cismon logs as well uh just to detect odd executables uh talk a little bit about DNS tunneling in case someone hasn't dealt with it in the past um so what DNS tunneling is it's a common technique used by bad guys or red teams to basically exfiltrate data it's usually used for command and control so you have malware on a box somewhere and you want to be able to periodically send short messages out of the network and you want to be able to get short messages back into the network the deviousness of this is it follows the standard DNS chain and so it doesn't
really ever connect directly to the the bad guys box so in this hypothetical case you have a client that usually points their DNS to some sort of DNS inside the Enterprise they're then pointed to whoever the Enterprise decides some Roots root DNS server out there um and then badguy.com registers badguy.com because he wasn't very creative and wants to get data out so what happens is this malware will generally send what seems to be random strings of queries to badguy.com and then that will go to the Enterprises DNS and if it makes it out they will say where's badguy.com out on the internet to their internet provider they will receive a request and then they will run
out to badguy.com so the message is that random string of um random string of data so it's usually encrypted in some way shape or form or xored or something it doesn't doesn't really matter too much but um they also because DNS has a response right you can also send data back in so you can send little chunks of data and like the IP address maybe Inc uh encrypted or something encoded some way shape or form all right so if you've never used Jupiter Labs it is pretty cool it you you can download it you know Mac you just do Brew install Jupiter and you end up it runs a little web server and the nice thing about it
is allows you to mix code with like pictures and and pretty text and so forth it's just a really good way of presenting your data um so um what we're going to do is look for weird in uh in in logs so does anyone want to take a wild guess as to what features we're probably going to want to look at and I've got prizes given to me by b-sides for it we've got two prizes all right
large Spike so frequency I'll go with that one because that's one of them that I got what do you have entropy yep so that's one I've got uh has anyone else got other ones fqdn lens um yeah but so with that one we're going to look at the sub domain right the the actual yeah so I guess the fqdn lens would work right because that would contain uh the subdomain so sure um so yeah that's more or less that's it but the important thing is is I don't specify the rules so I don't say like cerakata I can easily say uh if you see an fqdn length of more than 50 send me an alarm I don't really care about that
all as I say is look at these things and tell me what you see that looks weird out of this um so to start off uh we install a bunch of can you see that okay reasonably um a bunch of libraries so I mentioned that Zeke analytic toolkit it is free and it is very cool um pandas SK learn plotly for making pretty pictures as well um do some imports the reason that that is really cool is all I do is I feed it Zeke logs and it turns it into a panda's data frame uh it's pretty pretty simple if you've never seen Zeke logs this is the default format uh which is just it's rows of data with all the
other ones that also supports it in Json if that's how you're doing it um which you probably are but um so either way uh if you if it's Json it's just like an extra flag do you just say this is Json and it deals with it exactly the same and it turns this into a uh a data frame so each of these rows is a series and you can see that more or less oops um it looks exactly like you would expect something like Excel or something like that to look um all right so next we need to enrich the data right so uh calculate entropy you can see I put a entropy function which is Shannon's entropy which I got
off of Wikipedia not very difficult so this basically gives you a number between one and five based on what the overall entropy is like how random that that string seems to be um and then we can start querying out different fields from uh from that that data series up so in this case uh Zeke data frame uh there is a should be one called query up here right we can see that that is more or less what was asked for and um note that I don't have a for Loop right so I always say is on each query I want you to calculate out the length of the string and assign it to the query
lengths pretty easy next up we do something here's a Lambda function we say each query I want you to apply this so we're going to split based on the first period and grab the first um item of that array so which is going to be the subdomain return it as X and we're going to assign that value to the sub domain string right register domain string is going to be the rest of of the array so everything other than the first item subdomain length we just calculate out the length of it subdomain string here's the subdomain string um and then we take the subdomain string in this case and we apply it to that entropy function up here and we pass it
down and we give it the subdomain entropy and we end up with a new well it's it's the same data frame with some extra fields that we added pretty pretty simple if you look at the very first thing that comes out because I sorted by subdomain entry that doesn't look normal but we continue on some of this is my house Network so you know that iot devices they tend to do lots of weird things um so but you can see some of the stuff we've got pirate.c is making these weird things I would probably stop there and start looking at pirate.c but we can continue um all right so uh what do we do next so we
want the data based on subdomains right so hypothetically what is the average of all the the subdomain queries for that registered domain so we're going to break it now down into the registered domain and calculate out averages so we're going to take everything and what is the average entropy going to that R up TCP local which is an iot thing going out to Amazon AWS and and so forth you can see the numbers down here we add the average length and then the frequency so total number of of requests that were given um and we get to the isolation Forest portion um we say these are our features we want you to look at so average entropy
average length and frequency um and we mostly just copy and paste examples um from from isolation Force but we turn everything so we have the subdomain features we create predictions so this part is the isolation Forest portion so this is going to take a subset of our data and say in flag everything is anomalous so in this case we Mark anything as negative one if it decides it's anomalous it doesn't really know like what's bad it just says this looks like it's different from all the other data you fed me um and then next thing we're going to do is we're going to break it into clusters using k-means so we're going to take all
the anomalous data and we're going to say group them in the Clusters in my case I did four how did I come up with four I just tried it it was like do I see anything with four do I see anything with five um and until you get something that looks reasonable uh uh and then we apply everything I'm going to add the registered domain back and we run isolation Forest and we end up with four clusters zero through three um what is the weird data of this and we can see the first cluster zero looks very bizarre and probably we need to look into more right uh text strings I don't know why but it's it's heck
strings um we can see some other ones like you know this is this one's kind of interesting uh some of this ended up being like these two were a lot of iot devices uh the nice thing about this is once we've done this it's actually easy to take new data and you can say basically if anything falls into the future in cluster zero I want to send an alarm so we don't have to like we train we have a data we train it and if it falls in the cluster zero in the future give me give me information uh it's pretty cool I love plotly because it makes really really cool stuff this isn't really
related to the the machine learning portion but it lets you make these like interactive charts that are based on frequency length and average entropy and you can like Mouse over them um and you can kind of see that a bunch of the data ends up popping out in its own little cluster over there so that's kind of kind of neat um and so that is that uh the next one was Apache logs I started off asking my company they could give me a bunch of Apache logs and they said no because they couldn't show it off on the previous
maybe I don't you could probably tell me why it is better
regression yeah probably um it's not time series uh uh so you'd have to you could you could try it I mean it's mostly just try it and see what happens right um I I will say like I I've I spend ideas I'm like what happens and half the time it it doesn't produce anything of value right um so there's other things we could do for that um so Apache logs I my company was like you can't like share our Apache logs so I found that in Google if you type in in url access logs and filetype.log you'll find people who publicly have their access logs for some reason served on the internet so we're using a philosophy
associations uh access logs to look at um so it worked out um in this case uh access logs for uh uh let's see Apache yeah so these are access logs for Apache uh for the most part it's time um and then what was requested get post uh there's some other data for for um the different user agent strings and so forth I did find um I found examples of how to parse Apache logs but the big problem with Apache logs is they're configurable so everyone's Apache logs are going to be a little bit different so you kind of have to deal with that uh so you have to be like okay this is this field this is this field
this is this field Etc but it's it's not too hard I started with that and was able to quickly figure out how to do it um based on that code we turn that same data into uh uh into a data frame uh we start enriching the data so in my case I'm looking at the different Uris that were requested I do again things like um what are I messed with like user agent strings as well as doing entropy and so forth so get user agent statistics what are the unique uh user agents that are being presented as well as their frequency we can see that googlebot for example ends up being pretty heavily used um
let's see what else there is uh get URI statistics so this is um by the end of this I take all the Uris like what is the frequency that they're being uh requested what's the length of them entropy variable lengths and then the variable entropy so that's for like passing in the applications and so forth push them all that data back in the original data frame so I'm adding all that data back and then I start getting statistics about based on IP address so here's the IP address it had this many requests it had this many failures they tend to have this much entropy coming out of each one and so forth I turned this into a pretty picture again
I didn't see anything that really stood out maybe this one this IP address seems to have a high failure frequency but it it's probably some sort of Bot or something I don't have control of This Server so I can't really really look too much further into it um and then some Uris plotted based on on information about the Uris might be some data value and then more or less the same thing uh take it in this case I used eight clusters as opposed to four and you're just trying to look or do any of these items mean anything of use to me and if they do you can you can use them uh all right
yeah 15 minutes uh cismon data how many people have worked with sysmon data what what is it mostly in XML right XML is wonderful it's very easy to parse um I couldn't find a good data set uh for XML so I started doing this um there is an example how to parse this mon which is mostly copied and pasted from someone else's GitHub um but what I did find is miter publishes something called brawl which is apparently some exercise that they run um and they publish it in Json so it's not exactly the same format but it is some exercise they did there's some sort of like environment and they have automated attacks of some sort going on
that's about all I know from their their GitHub so I don't know too much more about it but it provided me the data set that I was trying to find so it's not exactly in sysmon format but I think it it works more or less I took the data and I turned their Jace on and one of the problems that they had was they have like their own weird format so like they have like game ID and stuff like that that's tacked on there um that I just had to deal with which it wasn't a big deal and then I can after that I can start treating as if it were cismon then what I did was I took all
the executables that were that had logs um I started looking at how many systems ran each of these executables right how many users ran these executables I thought that would be interesting um and you end up with something like this um that you can look at I also had connection count so the number of connections that were being made to a network and then I ran it through isolation first and if you look carefully you will see one of the Clusters has like philadelphia.exe and west.exe running out of the C directory we could see that it ran I want to say didn't make a lot of connections it's kind of hard to see with it zoomed in
um but it's more or less based on how many boxes that it ran on the total Network so that's so what I've got um is there any questions comments is there anything
um so so that's how we do things on my contract we're pulling data from that and doing analysis the one thing that this is good for that you can't do in like Cabana very easily all the time is being able to add data so like the problem if you're familiar with elasticsearch it's somewhat immutable once it's in there so um you can't like add Fields very easily you can do things like calculate the mean and so forth but I can't like pivot off of that data so like the Zeke example I can't easily say okay I want you to add a new field of a statistic that I have found on more advanced statistics if that makes sense but you
can very easily do this with elasticsearch as the back end and that's that's how we we generally do things um a way
yeah yeah that's actually pretty cool I forget what library it does that but you can you can take these cool like the these things and you can publish them to to a cabana which is something we found
um
um
they should have like data for hundreds of features
um intuition is one the other thing is if you have access to either red team reports or like you know all the crowdstrike reports and stuff like that look at prior attacks and like literally just go through the report and be like okay you know they list a DNS query was made what was the unique thing about that DNS query that ended up being a value to their investigation right so if I didn't know where to start that would be where I would start as well as just if you have experience doing this type of work like stuff like that you tend to know like okay these things are tend to be the things that I look for the other
thing could be just ask analysts like watch an analysts and see what they're looking at and have them describe why they're looking at it and then write it down would be the the areas I would look at anything else
searching so I'll look for the different field surface area
for how often you can develop this data that is like Google
um so usually what we're doing is we're building models and then we're flagging on the models in the future so it's more like we we try to come up with something of use and if it ends up being of use we do the the fit and then it's like hey you know this went into cluster zero send an alarm or something like that so where I would see you have to retrain the models anytime there's a significant change to the network or if you're finding that you know for some reason like this was working six months ago and all of a sudden it's been giving me a lot of false positives or something along those
lines and you just have to rerun it but the ideal scenario is you don't have to run this all the time you just you have a large data set you run it it takes a while it eventually builds out a model if you can take these models that are made and you can pickle them I don't know if you're familiar with pickle for you can literally just pickle it and then from there you can utilize that model and you just say hey I have a new data what cluster does it fall into and it's not like retraining the model but what it is doing is it's it's clustering and you just let it run and until it's
not providing value anymore and then you recreate it
production at scale so it's like do you like have your python code like in a kubernetes cluster and like scale it up like that or yes so we we are using something called kubeflow um which is a uh it's it's open source it's you can run in the cloud if you want we're doing it locally and kubeflow allows you to do that so mostly we would explore with something like this and there's actually Jupiter notebooks built into kubeflow which is really slick and then if we find something that we think is a value we'd probably rewrite it in pi spark um I don't I'm not a huge fan of Pi spark because what I found is it's uh
it's it's it's python because it's Pi spark but it's actually just a wrap around Java so like you it's very bizarre because like things aren't the same it's like it's close enough to python but it's not actually python um but it is it is more distributable and so forth so that's the benefit to it but Cube flow allows you to distribute out to a large set of clusters more or less five minutes anything else questions comments
and I wonder how much they are
from experience you see too many things like tiring people and like like
I would be very reluctant to block right now based on anything I've seen so I usually like with if you never know like cerakati you can block or you can not block I would probably at this point not block I think where it would potentially be a value is is really just taking reducing our work right um instead of hundreds of false positives maybe we only have 15 or something like that as well as presenting information that we don't actually know like I think that's really the benefit is like hey I send it into an unsupervised learning and it sees something that's weird is that actually weird I don't know um just sort of checking our
our preconceived notions and so forth is where where it can be useful um I I don't think I would let it like just start running a muck on my network and like controlling it and like hey I see something I'm gonna kill that host because it's now anomalous right I would not trust it for that yet
uh no other than what I've got um not entirely no this is this is about what I've gotten all right anything else and I can't also share directly like the stuff that we actually do either so that's the other problem so all this was like mostly me learning of what I'm supposed to be doing so um I just started messing around locally before I started doing it at scale
experience yeah we tend to hate like repetitive jobs and this is where this is a lot more fun than a repetitive job that's the other thing like instead of going through thousands of logs I would much rather like try to convey something to a computer and have it do that for me so all right thank you very much you can grab me anytime and ask more questions
Related talks
 55:25
55:25 37:47
37:47 50:00
50:00 46:01
46:01 55:44
55:44 37:48
37:48