My Cyber Sense Is Tingling! Detection Engineering With Free Tools
Show transcript [en]
Morning everybody. Can you hear me? Okay. All right. Excellent. So, um my name is Matt Gracie. I am from Buffalo, New York. This is my first time at uh at Bside San Antonio. It's always this warm here, right? Cuz it was snowing back home like a month ago. >> But not yet. >> All right. So, we'll start with who I am and what I'm talking about. So, as he said, my name is Matt Gracie. Uh, I have a lot of jobs. I organized the, uh, the Bides conference in Buffalo. I organized a lot of other community events there. Um, I am a adjunct professor in the graduate program in cyber security at Kenishious University in Buffalo. Uh,
Kenishius is one of the 26 Jesuit colleges and universities that are not Georgetown or Boston College. Uh my main day job is I work for a company called Security Onion Solutions. Uh who's heard of Security Onion? All right, fair number of people. Uh so Security Onion is the tool that I'm going to be talking about today as sort of the uh the focus of these detection engineering lessons. Uh I want to make clear at this point I work for Security Onion Solutions. I do professional support for the Security Onion platform, but this talk is in no way a sales pitch. Nothing that I'm going to show you costs any money. You can get our software for free from our GitHub. We
don't even want your email address. You can play around with it however you like. Okay? Free and open platform. Uh it's totally uh up to you. You can do whatever you want with it. Okay? I just I know there's always some confusion. So, I just wanted to say that upfront. Before I worked for Security Onion, I was a blue teamer for about 15 years. I worked in a lot of different industries. Uh so this is some lessons that I learned about tuning tools and doing detection engineering over those years. This is not intended to be a super in-depth technical talk on the security onion platform. Uh if you have questions about it, if you've deployed it and
couldn't get something to work, flag me down afterwards. I'm always happy to talk about that stuff. This is more of a highlevel capabilities. How do we turn thread intelligence and indicators of compromise and stuff that we're looking for into rules so that we know about it when evil rears its head in our network? So first things first, what is cyber threat intelligence? I have a couple of slides like this with definitions that come at it from different angles. So according to CrowdStrike, threat intelligence refers to the collection, processing and analysis of data to understand a threat actor's motives, targets, and attack methods. Right? This is more of the how do I produce thread intelligence side of things. How do I
take raw data or raw IoC's or raw log files and turn them into something actionable? Turn them into intelligence that is useful to me as an analyst or as an investigator. Right? From the other side, I have this definition from Gartner and this one's a little bit older. Uh I think this paper was from 2013. uh and this kind of shows how the attitude toward threat intelligence has changed in our field in the last 10 years. Thread intelligence is evidence-based knowledge including context mechanisms indicators implications, and actionable actionable advice about an existing or emerging menace or hazard to assets. Right? So, this is more of a these are the bad things to look for, go look for them. as
opposed to CrowdStrike's definition which is more um here's a whole bunch of data how do we turn that into something more consistent right something more than just a scattering of IP addresses or a scattering of hash values but rather actual intelligence about our adversaries okay I'd love to tell you more about the Gartner paper but it's from 2013 as I said and also $200 so I'm going to skip past this slide now where do we get threaded intelligence. Uh if you're in a huge enterprise, you might have your own threat intelligence team, right? I know uh one of my co-workers came from General Electric, right? General Electric, huge company, hundreds of thousands of employees. They
had a whole threat intelligence division. Another good friend of mine uh runs the IT department for a community college in North Carolina. His entire IT department is one person. So, you know, depending on your scale, you may have a lot of different options for you can get this threat intelligence. The most basic place and uh one that has come up in some of the other talks that I attended this morning is thread intelligence that comes from vendors, right? Microsoft, for example, has a huge thread intelligence department. They publish a lot of it. Uh this is from their blue sky account. Um the Verizon debugg I think has been mentioned in every talk that I've been
in this morning, right? That is a treasure trove of thread intelligence information about what actors are actually doing and things that you want to look for. uh companies like Huntress or Crowd Strike. Um I believe uh Unit 42 from Proof Point puts out an annual report. There's a lot of these different vendor reports uh that are more or less applicable to you depending on your industry and depending on your infrastructure, but they're definitely worth a look and most of them are freely available uh for values of freely available that include giving them your email address. Okay. Another good source uh for threat intelligence, especially if you're just starting out or you're looking to stand up a purple team program or something
like that, is the MITER attack matrix, right? So, as you know, MITER attack is essentially a taxonomy of attacker techniques, right? How do the bad guys breach networks? What do they do once they're in there? How do they laterally remove? How do they exfiltrate data? MITER attack also includes adversary dossas like this. This one's for scattered spider uh currently running rough shot over AFLAC and the rest of the insurance industry. Um MITER publishes all of this data comes from open sources and they'll publish things like campaign summaries. What did the bad guys do? How did they get in? It's fishing or it's stolen credentials. Um what did they do once they were in? What artifacts can you look for? What
sort of malicious software do they use? Are they using info stealers? Are they using C2 frameworks? If so, which ones? Right? MITER attack digests all these open sources down. They put it into this very convenient form and they give you indicators to look for. Right? And over the last what 5 10 years that attack has been around, a lot of tooling has also been modified to incorporate these uh these miter attack taxonomy codes. So the tactics and techniques you can look at throughout your defensive stack and see, okay, I have coverage for this. I have coverage for this. I have coverage for this. It's not perfect, but it gives you something. Depending upon your industry, uh you may
be affiliated with an ISAC, right? Uh ISACs are intelligence sharing and analysis centers. They're a public private partnership. Um and they exist for a variety of different industry verticals. When I worked for an insurance company, we were a member of FSAC, the financial services ISAC. uh when I worked for a healthcare company, we were a member of HSAC, the health ISAC. A lot of these ISAs have industry specific threat intelligence that they share with members, right? Um additionally, if you're part of a larger group inside that industry, you may have your own sort of little internal threat intelligence groups. I worked for a Blue Cross and Blue Shield provider for a while. We had an internal threat
intelligence uh group that was sharing information among specifically Blue Cross and Blue Shield providers. There's a couple dozen of them in the US, right? Ranging from giant ones like Anthem to Blue Cross and Blue Shield of Vermont, which I think also makes ice cream. Um and we all shared intelligence because we were all dealing with the same threats and the same threat actors, right? If you are part of a industry that has an ISAC and your employer is not a member of that ISAC, you should look into getting membership. It is probably the most cost-effective way to get good verifiable industry specific threat intelligence. Uh there are also community threat exchanges. Uh this screenshot is from uh
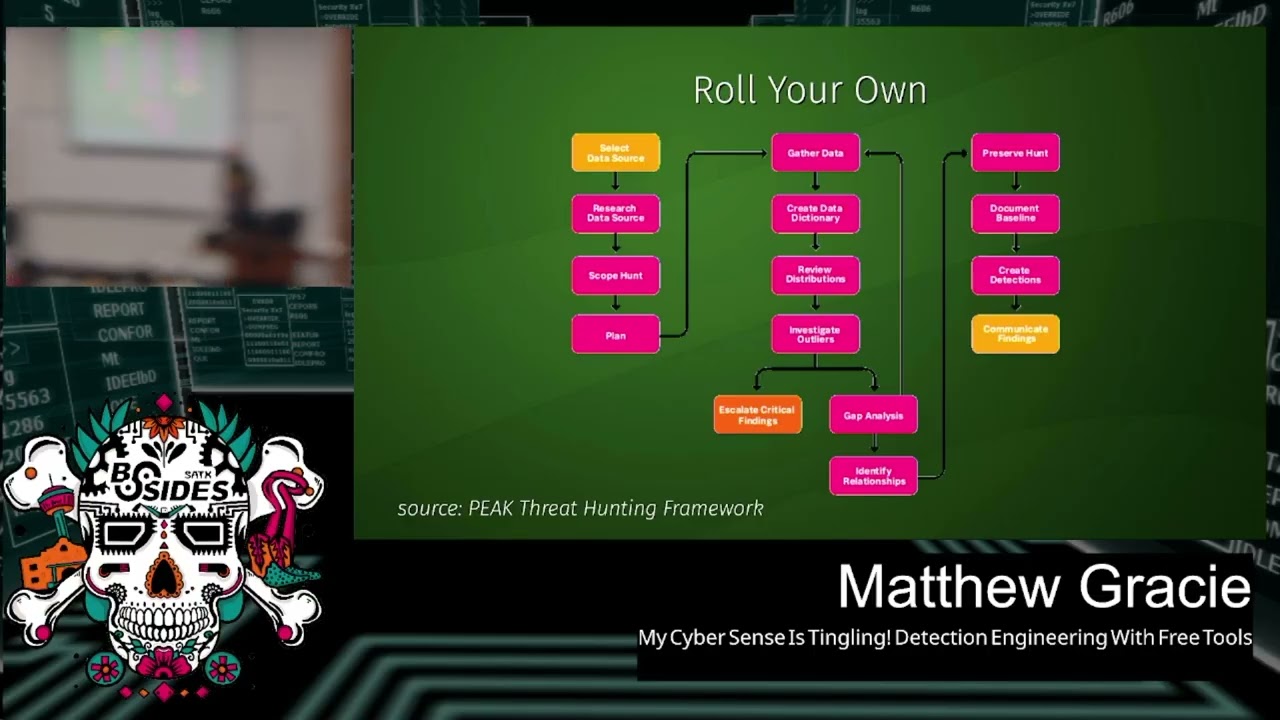
the old alien vault OTX, the open thread exchange. Uh it has a new name now which is escaping me. I don't know if anybody knows it. Um but uh people will do things like run a honeypot in their Azure instance and then publish the IoC's, publish the IP addresses, publish the tooling of the groups that attack it, right? So you can subscribe to them, import this into your own tooling uh into your thread intelligence uh platform of choice. And finally, there's always the option of rolling your own. Um, so this outline, does anyone Does anyone recognize this uh this diagram here? >> What? >> Very good. Very good. >> Used to be called >> back in the day. Yes. Yes. So, same guy.
Um, so the peak threat hunting framework is from uh Splunk. It's by Dave Biano. uh this is their baseline threat hunting workflow, right? So if you establish a baseline of normal behavior in your network, in your environment uh and then you investigate against that baseline looking for outliers, that's what this this whole workflow is here. And you can see at the bottom, you investigate the outliers, you escalate your findings, you do your gap analysis, that is where did my detections fail, where did I not see these outliers, why did I not get alerted to them, and then in the last column here, this is the uh the a the analysis portion of peak, you create
your detections, right? So when you're going out and doing a threat hunt in your environment, what are the outputs from that process? One of them should be threat intelligence. And then you can take that thread intelligence and turn it into new detections. Right? Again, this is going to depend upon the scale of your enterprise, how much logging you're bringing in, how seriously you're threat hunting, but this is the best way to get stuff specific to you because it's data that was generated specifically by you. All right, a question for the class. Who recognizes this diagram? You already got an onion. >> Yes. Pyramid of pain. >> The pyramid of pain. Very good. This is another Dave.
So, I am going to owe Dave uh two bucks the next time I see him because I stole two of his diagrams for this presentation. Uh the idea behind the pyramid of pain is this is how we can sort of triage our threat intelligence to determine what is effective and for how long, right? And the way it's organized is the uh IoC's that are the easiest for the bad guys to change, the easiest for them to pivot away from and show something else are down at the bottom. Hash values, right? If I get a hash value for a piece of malicious software, how long is that going to be good for? A day, maybe, maybe two,
right? It's very easy for the bad guys to change. All they have to do is recompile it. All they have to do is add a bite, right? and the hash value completely changes. Now, I'm not saying that hash values are useless, um, if you have a thread intelligence workflow that's fast enough and you're constantly updating them, you know, you can still get some utility out of them while they're good, right? While a ransomware campaign is going on, you can you can spot that implant until the hash value rolls over again. Uh but for the most part, this is not going to be a longlasting indicator of compromise that you can really take advantage of. IP
addresses also pretty easy to change to pivot away from, right? Uh somebody may run one campaign on AWS, they may run another one on Azure, they may run another one on Digital Ocean, they may run yet another one on Digital Ocean because that's where they always are. Um but these IP addresses come and go, they get changed, right? How many people run Surakraata in their environment? Anybody? Okay. So, as part of the emerging threats rule set that comes by default with Surakraata, there's a bunch of rules for suspicious IP addresses. They are always wildly out ofd, right? Just because that stuff changes rapidly, right? Which is why it's down here at the bottom of the pyramid.
Domain names fairly simple to pivot away from. God knows there's enough top level domains these days. I'm uh I'm old. I've been in IT since the turn of the century, which I like to say to to make all the other Gen Xers wse. Uh I remember five top level domains, right? Um network or host artifacts. Right now we're getting into the stuff that's harder for the adversaries to change. If they're uh if they're always using PS exact to do the lateral movement or they're always opening named pipes, right? we can write detections around that and it's much harder for them to change it up. Right? If they're changing the name of the executable that they're
using or they're changing its hash value, that's simple. Changing what it actually does, that's harder. We need to remember that these thread actors are like any other IT organization. They have uh interns, they have documentation, they have processes in place, they have playbooks, right? So the higher we go in this pyramid, the more stuff they need to change, the harder it is for them. Tools very challenging to change. If you've got your thread actor group and they're all using Sliver and you write some really good rules around Sliver and they want to pivot to Cobalt Strike or Mystic or some other framework, it's going to be tough, right? So, uh, we're getting up toward the narrow wedge of
the pyramid here. And finally, TTPs, tools, tactics, and procedures, right? If we can write rules that spot their actual methodology independent of the tool, independent of the hash values, independent of the IP address, independent of the domain name, right? If we can write clear, consistent, actionable detections based on the TTPs, uh, then that gives us really good alerting and it's really hard for the bad guys to change it. Right? So that's what thread intelligence is. Now the question is, how do we leverage it? Right? Say we get a report from Huntress or from Verizon or we even get a spreadsheet of IoC's from our from our ISAC, right? How do we take that and apply it to our network? How do we see
what's going on on there and look for matches?
>> All right, so this is where I talk a little bit about Security Onion. So, Security Onion is a free and open platform built by defenders for defenders. And that's true. I always say our secret sauce is our entire development team is ex blue teamers. So, we're just building the tools that we really wanted when we were doing this. It includes network visibility, host visibility, intrusion detection, honeypotss, log management, and case management. Right? So, open-source project uh free to download, free to deploy, bunch of different capabilities. uh if you haven't used it in a few years, it's really changed a lot. I'd suggest checking it out. What capabilities are we interested in specifically for this detection
engineering case? These right? We're specifically interested in network visibility. We want to see what's on the wire. We're specifically interested in host visibility. We want to see what's happening on our endpoints. We're specifically interested in log management, right? because these are the sources of operational data that we can use to compare against our threat intelligence and look for bad guys right look for those indicators of compromise look for those IOC's how does security onion implement these well for network visibility we have a few different items in the stack uh there is a IDS engine uh it was Snort back in the day now it's running on Surakraata what Surakraata does for those who haven't used it before it's a
signature-based ids. So every network flow that is observed by security onion and I don't want to get into the architectural details but basically you plug it into a a span port or a tap infrastructure on your packet broker um and then it reviews the live network traffic as it sees it on a network port right um every network flow is compared against a database of signatures uh the signatures can be as broad as any traffic from this address to my internal network or it could be as specific as you know DNS traffic of this length going here. Um, if there's a positive match, then it raises an alert, right? Uh, the thing to remember here is what
what we're observing is real time network flows. We're not uh we're not looking at anything after the fact. It's all happening in the moment. Uh, we also have metadata generation. So, by default, this is done with Zeke. Newer versions of Surakraata can also do this. The platform allows you to choose either one, but I'll I'll talk about Zeke because that's the default. uh that same network data that's being observed uh that we're reviewing with Surakraata, Zeke is generating metadata about it. So for every IP connection on your network, you get a connection record. What IP address, what source port talk to what destination IP on what destination port, how much data did they exchange, what flags were set, right? So
was it a full connection? Did it did it end without a FIN? Was it just reset? whatever you get all that information about the connection itself. It's like net flow. If it's a well-known protocol, you also get additional information about that particular protocol. So, for example, if a file is downloaded via HTTP, you'll get a connection record. You will also get an HTTP record, right? What was the user agent? What was the HTTP status code? What was the URI that was accessed? You'll also get a file record. What was the MD5 hash of the file? What was the original name of the file? What was the mine type of the file? Etc. It will generate all of these logs and put them
into an elastic search database on the back end where we can query them and search them and pivot on them. Right? It also does file carving. So, as it's watching these network flows, certain mime types of files will be carved out and then reviewed. So PDF files, Microsoft Office files, um, executables, I think that's it by default. You can set it to any MIME type you like, but we find that in super busy networks, you know, you don't want to carve out all the text files, for example, because a lot of your web traffic is just text/plain and you end up uh with a bunch of useless files. For host visibility, uh, we integrate the elastic agent. That's an endpoint
agent that does log gathering. So on a Windows host it will get your application logs, your security logs, your system logs. It'll also get logs for things like sysmon, powershell, uh defender, right? The stuff that your Windows host is generating by default. Uh and it will also gather telemetry information. So when an endpoint host opens a network connection, makes a DNS query, uh changes something in the registry, writes a file, reads a file, all of that telemetry is also generated by the elastic agent and sent into that same backing database. All right. And finally, uh and that's that's across Windows OS 10 and Linux. So whatever operating system you're running on your endpoints, um really wish it worked on
Chromebooks. I want to know what my kids laptops are up to. But, uh, it'll pull all of that telemetry data and put it in your central location. And finally, log management. If you have, uh, network devices PaloAlto Cisco Forinet um if you're using cloud services, things like Octa, uh, or if you're using a cloud environment, AWS, Azure, Google Workspaces, we can pull all of that in, normalize that data, and put it in the same place, right? So these are all the the raw material on the other side of the ledger, right? We've got our thread intelligence on one side and then what we need to do is pull in all of this operational information from our environment on the other side
and look for matches, right? But what detection languages are available to us to do this? Uh Zeke has a functionality called Zeke Intel. uh you can give it things like hash values or DNS domain names or IP addresses and if it sees them it will raise an alert. Very simple, right? And again, we're we're playing at the bottom of the pyramid here, but if you can turn these around fast enough, it can still be pretty effective. The surakata detection language uh is all again network-based. We're talking about matching up signatures to network rules. uh it can introduce a little bit of overhead if you start doing reaxes and stuff that's really complicated because again you got to remember that
if you deploy a soricado rule it's going to be applied against every single network flow that your sensor sees right um so it can be done but sometimes it's a little bit uh a little bit much we support Yara for evaluating files that are carved out by that file carving process uh Yara for those who haven't used it you can think of as a very advanced version of string Right? It looks for structures inside of files. So by default, uh when Security Onion and Zeke carve out an executable file, it will look at things like all right, what libraries were imported into this executable? What compiler constructed it? Is it digitally signed, right? And it'll look in these uh it'll
develop this sort of dossier all about the file, and then if there's something suspicious in there, it can raise an alert, right? And finally, Sigma. Sigma is awesome. Has anyone played around with Sigma at all? Okay. All right. So, quick, you know, elevator pitch. What Sigma is. Sigma is a platform agnostic detection language. Uh, back in the day when there was a new piece of malware or there was a new piece of threat actor uh activity and we wanted to detect it, what would happen? Well, somebody would write a detection for Splunk, and somebody else would write a detection for uh Arsite, and somebody else would write a detection for Q Radar. God help them. And somebody else would write a
detection for Sentinel, right? All of these different products all had different query languages. They all had different information that they gathered by default. So, uh, generating the rules was very much a one-off thing. you'd have a separate rule written for each of these. Uh, Sigma, and I should really have the X XKCD comic about standards here. Sigma is a new standard that's a platform agnostic language. Basically, you write a YAML version of the detection and then you compile it for your particular environment. So, the same detection rule can be used in Q radar, can be used in Sentinel, can be used in Elastic Search, can be used in Splunk. Right? The syntax um is universal across all of these and
then you run it through a sigma compiler to get a query for your particular environment. What this means is that every log that you are collecting is now a detection opportunity. Right? So we were talking before about all those endpoint logs that we're picking up and all those network metadata logs. Right? Everything on the wire and everything happening on your endpoints is now a detection opportunity. You can write a sigma rule to alert on any log that's being collected. It's awesomely powerful. So, what does our workflow look like? Well, first you got to choose your indicator, right? What are we looking for? Uh, are we looking for a hash value? Are we looking for a flag in a network
packet? Are we looking for a IP address? Are we looking for a particular digital search that's being used to sign malware? Right? Depending on what indicator we're looking for, that's going to drive what data source we use. Often there's more than one choice, right? Sometimes there may even be a couple equivalent choices in terms of efficiency, but we want to very clearly define what we're looking for so that we can figure out what is the most efficient way to find this badness in our environment. Once we've identified the data source, that will tell us what language to use, how we need to model it, and then we can write and test the detection, right? Uh
this is, you know, sort of meat and potatoes stuff. If you've ever done any kind of purple teaming, right? You uh you simulate an attack, you realize that you did not detect the attack, you write a rule about it, then you then you simulate it again and hope that your rule works, right? Finally, you can deploy it to your production environment, and then you can monitor and tune because something always goes wrong eventually, right? All right. So, I'm going to get into an example in a moment. Does anyone have any questions at this point? Everything making sense? Everything sounds good? All right. So, I'm going to use a workflow example that we actually use in one of our
training courses. Um, so this would be an example of the rolling your own uh thread intel, right? This is something that we use in one of our thread hunting courses. So, a recent threat hunt identified data being exfiltrated from a workstation by a malicious process named wombat.exe. Why? Because it's a funny word. This executable had an original file name of DNS exfiltrator.exe and was sourced from GitHub. So, you know how uh when you execute something in Windows and you're monitoring it with sysmon or something like that, you'll get the command name, but you'll also get the original file name, right? So, that's what that's what that's talking about. The original file name and attribute was DNS exported. It
was written to disk by another executable called AV update.exe which was downloaded from a counterfeit website the user was sent to by official email. Wombat.exe was excfiltrating files using encoded DNS subdomains and very long text queries all through the domain three scoops.online. Again, becauseline domains were free the week that I was making this. Um, we have the email address that sent the fishing email. We have the hash values for AV update and wombat. We have the IP addresses for the counterfeit website for the C2 that was controlling AV update and the destination of the DNS requests. So, how do we detect this in the future? Well, the first thing we need to do is take a look at this thread intelligence
and figure out what indicator is going to be the best. We've got wombat.exe information, right? We've got the hash value. We've got the executable name, all that. We've got the original file name, DNS Exfiltrator. We've got AV update. We've got the uh the actual network traffic where it's encoding DNS subdomains. Uh we have the top level domain and the uh and the domain name three scoops.online. We have email addresses. We have hash values. We have IP addresses. Right. So, if we look at all of this intelligence in the context of Dave's pyramid of pain, right? We've got our hash values, we've got our IP addresses, we've got our domain names, we've got our network artifacts,
we've even got our tools, DNS.exe. So, which indicator uh do you think would be the best for us to build the detection around? Uh, you already won. >> Did you have your hand up? >> Oh, yeah. TTPs. >> TTPs, right? So, what would be a good TTP >> in here? >> I want to do one um executable uh change the name from DNS Exfiltrator. So, if you can tell that they changed the name of executable. >> Okay. So, if the original file name doesn't match the current file name. Yeah, that might be a good one. Okay. Any other guesses? >> Yeah, >> I would look for the length of the text queries. >> Length of the text queries. Okay. Why is
that? >> Because text queries are rare to begin with. For normal operations, the fact that they're very long and they're going to, you know, encoded domains, you can look for all of those and have very tight alert. >> All right. Very good. So, we're at the very top of the pyramid, right? We're talking about the TTPs. We're talking about what the bad guy is actually doing. So let's let's think about how he would evade our detection, right? We have the hash value for wombat.exe, which is the actual exfiltration tool. We can look for that, but it's not going to be good for very long because the next time GitHub releases DNS Exfiltrator, even if he gives it the same name,
right, it'll be recompiled. It'll have a new hash value. If the thread actor decides to compile it himself, and again it's from GitHub, you know, he can set the original file name to whatever he wants. He can set the the new file name to whatever he wants. The IP addresses, those are probably going to change in the next campaign, those aren't going to do us much good at all. Um, but if we're alerting on the TTPs, even if this threat actor tears the tool down to the ground and rewrites it in, what are the cool kids using now? Rust. Rewrites it in some new language. If he's using the same technique to exfiltrate data, we're still going to
catch it, right? And if his tooling on the attacker side, if his receiving server is expecting this encoded DNS as a method of excfiltrating data, we're still going to spot it, right? He can change everything else. He can change the IP addresses. He can change the hash values. He can change the domain name that he's using. But if he's encoding stuff in these long text messages or these long text queries, and as you said, you know, TXT queries are not super common in most networks, then we're going to be able to spot it, right? If this tool ever shows up again, that's what we see here, right? These are all good spots where we can spot
TTPs, but this is probably the tightest one here. We want to look for very long DNS queries of type TX txt. Right? This is the sort of network metadata that Zeke pushes out. So now we know what we're looking for. Now we need to identify our data source, right? What are we looking for? We're looking for super long DNS queries. What data source is going to get us that? Well, we can analyze the DNS metadata from Zeke, right? Uh, every DNS query that occurs on the network that is observed by Security Onion, is observed by Zeke is logged. Those logs include things like what is the DNS query type, what was the query, where was it going,
etc. Right? So, if we have a concentrated batch of these very long DNS queries, Zeke is going to spot them. We can look for DNS queries in endpoint telemetry. If we've got the elastic agent deployed or if we have some other EDR agent in place, then uh we can track the DNS queries that are being made by endpoints and uh if we see them of a particular length, we can raise an alarm. We can use logs from our internal DNS server. Right? Most uh especially most small to mediumsiz networks, what's the DNS server? It's the domain controller, right? So, we can read the DNS logs off of the domain controller, put those into our elastic search database, write some
rules around those. Or we could write a custom IDS signature. We can say every time you see a network flow, if it's a DNS network flow and the length is above such and such, and this set of bytes corresponds to a text request, uh then we can pull from there. Right? These are all possible issues or or possible um possible points where we can raise this alert. Uh does anybody have a suggestion for which one of these might be best? >> All of them. >> All of them. Yes. If if we're only if we're only doing one or two, right? Anybody? >> Yeah. >> Endpoint telemetry. >> Okay. Endpoint telemetry be good. Uh why do you say that?
um can't hide what's going on at the end point. >> Fair enough. Yeah, if you're if you're pulling in your endpoint telemetry with elastic agent or if you've got crowd strike or carbon black or I don't know, I've been out of the game a couple years. Whatever whatever the cool kids are using for endpoint detection response these days. Um that might help. Any other ideas? I think every one of them has uh their own inherent issue. And depending on how serious this particular thing is, >> you might want to consider >> layering it >> like an onion. >> Much like an onion, yes. Everybody likes parfait. All right. So, my suggestion, and again, they all have trade-offs. My suggestion
would be to go with the DNS metadata from Zeke. And the reason for that is for one thing um if you look for the DNS queries and endpoint telemetry uh who has ever worked in a large enterprise where every endpoint actually had all the agents it was supposed to and they were all turned on right uh so it's possible that the endpoint that gets compromised is the one that does not have edr on it that does not have the endpoint agents that it's supposed to, right? It was part of a virtual desktop uh infrastructure roll out during COVID that everyone forgot about and now it's being used as a point for lateral movement, right? So, if we're
not collecting those logs universally, we may have some have some blind spots. Logs from the internal DNS server, same thing. What if they're using this Exfiltrator tool to directly hit an external DNS server? You're never going to see them on your on your domain controller. Those logs won't be written, right? custom sorakata ids that would probably work but again you're adding a little bit of overhead to your your soricata implementation. If you want the alert to happen instantly if that's your threat model then that might be a better way to go. the sigma rules. Uh if you're writing rules against the DNS metadata in Zeke, those might take a couple minutes uh to activate, right? Because
the DNS query is made, the Zeke subprocess sees it, it writes the log that's sent into Elastic Search, then there's a search of your collected logs, and then there's a match. Could be 3 4 minutes before you see an alert. most environments probably not a huge deal. But if you're talking about a specific, you know, high security or high vulnerability or or real crown jewel sort of system, you might want to look at the IDS piece. So, we figured out we're looking for long DNS text requests. We've identified the data source we're going to use. We're going to look at it in those Zeke DNS logs. How do we write the rule? So, I apologize. I know this is a little bit
of a an eye chart, uh, but this is what the sigma rule looks like for doing that, uh, log query, looking for long DNS requests. Uh, as you can see at the top, we have a log source tells us what particular logs in our elastic search database we're looking for. In this case, we're looking at Zeke DNS logs, you know, DNS request logs that were recorded by Zeke. And then the detection stanza there in YAML is the details of the detection. So we have two items here. First of all, we are looking for a DNS query of type name txt. Right? And then we are also looking for a DNS query length greater than or equal to 200
bytes. Right? So what this will do is when we put it into action, it will take this sigma syntax. It will turn it into an EQL query, an elastic query language query, and then that query will be run against our collected Zeke DNS logs every 3 minutes, right? And if there's a match, it will raise an alert. This is not specific to Security Onion. As I said, Sigma is platform agnostic. If you wanted to build this detection in Splunk, if you wanted to build this detection in Q Radar, if you wanted to build this detection in Sentinel, it's the same syntax. You just run it through a different compiler because you're dealing with a different query language,
right? Um that part of our brains that we used to use for phone numbers, I'm pretty sure it's all just different vendor query languages now, but this this makes it a little bit simpler. Then we can deploy it to production. We can take this, we can put it in our uh production instance, whatever is collecting these Zeke logs for us. It will start analyzing them. It will start alerting on long text issues. And finally, we monitor the rule and we can tune it. Uh, it's entirely possible that there's some janky piece of hardware on your network that everybody forgot about that's supposed to be controlling the HVAC and is making giant text queries and nobody noticed until
you wrote this rule, right? Um, or it might just be compromised. But, uh, you know, enterprise environments are really weird. There's always strange stuff going on. Uh, so after you deploy this, you're probably going to have to start tuning, looking for false positives, maybe saying ignore this IP address, ignore this destination address, put in a thresholding rule so it only happens if you see three or four of these in the course of a minute, right? Um, there's ways to tune it to make it more effective. All right. So, conclusion, threat intelligence is gold when it comes to understanding what adversaries are actually doing, what threat actors are going to do. So if we take that
thread intelligence whether we roll it ourselves or we get it from our Isaac or we get it from Verizon or Huntress or one of these other companies that we've all been talking about today uh we can take that we can filter it via the pyramid of pain to determine what indicators are the most useful to us what are going to give us the fewest false positives what are going to have the most longevity right we want to look at TTPs we want to look at actual tooling we want to avoid using things that are easy for the actor to change like hash values and IP addresses and then we can take those indicators and build detection rules using free tools
so that if any of this stuff shows up in our network we're aware of it. Okay. Um I have a couple minutes left for questions. Um if you want there's my blue sky account. You can follow me. If you have a question you can always send me an email and I'll post these slides on my GitHub. I think they're also on the schedule site for the conference. Uh if anybody wants some Security Onion swag, I've got some stickers and stuff down here. Feel free to help yourself. Uh otherwise, I believe I have a few minutes left for questions. Anybody? I was that thorough. Yeah. What's up? >> What are some I guess online community or like forums? what you recommend
someone who wants to do detection engineering kind of stall out helping to maybe get like I know you mentioned like viral and stuff um are there any kind of additional homos like a forum or anything like a community kind of >> uh we do so we have a discussion forum but it's honestly it's more engineering focused than detection focused it's more you know people who are having implementation issues Um the stuff like the the SANS internet storm center is really good. That's a good source of up totheminute IOC's and stuff. Uh in terms of this process, I know some of their summits have t have touched on detection engineering stuff. Um I can't think of any sites offhand
specifically around this though. >> Um you >> could look up sock prime. >> So prime. Yeah, if you haven't heard of that one, but they to some extent you can get a few things without pain and it is all sigma language uh rules that you can apply to your own environment and it's a good place to go and look at what other people have written. Oh, and one other thing I want to mention, I didn't have time to put it in the slides for this week, uh, but we also released another really cool thing this week that's going to be in our next release, which is, uh, incident response playbooks that are joined to rules. So,
you can write a detection rule and then when the alert fires, there will be stepbystep instructions for the analyst, including contextual information pulled out of the logs. So, like, oh, this malware fired. what other hosts has it touched in the last 15 minutes? What other alerts fired for this host in the last 24 hours, etc. And it builds it all out for you. Really, really cool. Uh there's a dete there's a uh a video on it on the Security Onion YouTube channel if you want to check it out. And that should be out in the next couple of weeks in our next release. >> Yeah. >> Uh is the when do the agent uh was the
last feature? >> Uh in version 2.4 4 we used the elastic agent. Uh so in 2.3 we had three separate agents. We had waza osquery and then filebe or wind logbe if you're on a windows uh endpoint. Uh now that's all been combined into the elastic agent. Uh the really nice thing about that is the elastic agent is actually uh centrally configured. So once your agent checks in with the security onion server, you can do things like alter its configuration. and tell it no, no, I want to watch this log file, not this log file. Um, that's all done through the web interface, rather than, you know, banging out YAML files on the endpoint anymore, which
makes it a lot easier for for people either in a large enterprise where they can't get their hands on the endpoint or people who just aren't as comfortable with doing that kind of manual configuration. All right, anything else? Are we all ready for lunch? >> Lunch. Excellent. All right, thank you for your time.
Heat. Heat.
Related talks
 51:46
51:46 47:47
47:47 30:07
30:07 25:06
25:06 57:19
57:19 34:35
34:35