Cyber Cartography: How to Model Cyber Terrain
Show original YouTube description
Show transcript [en]
hello my name is Casey Smith and the title of this talk is cyber cartography how to model cyber terrain this is recorded for b-sides Boulder 2022 for the virtual track hope everybody's doing well and thanks to the organizers for giving us a chance to present virtually not all of us could be there but hope to to meet up with everybody soon so you can connect with me on Twitter at sub T thanks for watching uh and or watching either at the event or later on I appreciate it and this talk will be some of it's speculative and really just trying to drive curiosity and Innovation so feedback welcome and I look forward to hearing from you
really three big ideas that I wanted to cover in this and they are first is our models versus reality how how are how do we use models how do they affect our perceptions or experiences how do they align with reality how do we update models secondly uh the idea that defense and offensive tools need the same perspective and that makes things better overall over time third is combining things and learning from other disciplines or other domains so how can we draw from domains like medicine uh you know meteorology and how can that inform our cyber security processes and models and then lastly along the way some case studies and references that may be helpful for you if you like this
so these are some things I've been working on over the last few months and so I always like this far side cartoon where these two spiders have this web across the slide and they basically say if we you know if we pull this off we'll eat like kings so if I pull this off uh it you will be at a minimum entertained and hopefully find some useful content so I want to start with a map so some of you will recognize when you see this map immediately where this is or you may even be able to quickly translate that to what it might look like over the horizon if you were to to be standing at a point on this map and
see it others of us it might take more context or more perspective so when you think about Maps we could look at this and we can see things like bodies of water uh various slopes or steepness or grade of the terrain we could see maybe communities and Roads so but it may not be enough to help us form a really clear picture of what this would look like so we may need additional context so how about now does that help at all provide any context some of you are thinking no not even a little bit so you know what about now sort of like if you've gone to the eye doctor where they changed the lintus which is clearer so
this is Mount Albert the tallest 14er in the state of Colorado this is a prospective uh sort of standing on the road looking to the West uh just south of Leadville and the reason I bring this up is it's important when we're describing a thing that we use maps but maps are a reduction or an abstraction and so the map is not the territory excuse me and it may take multiple perspectives to get the ground truth so the first part of this is really to drive that point home how we use these models versus an experience of a particular thing another example I want to use is if I were to present this music to you what
does this sound like what what do you hear when you read this and I know that may sound funny but some some people are trained and can actually instantly pick this out and hear this playing in their mind others of us need to need to actually hear the music and then we can start to see the patterns in the notes on the page so I'm going to try and get this to play real quick and see if this helps identify this foreign
[Music]
okay hopefully that helps identify the song as Thunderstruck the soundtrack for hacking of course that's debatable but according to at least one news article that's fact so anyway the idea though is some of us can look at that and and see that I can't but some people can look at that and and hear that song all those of us need to hear the song and then we could recognize the patterns uh in the model or in the sheet music so music can be transferred across time and location by writing it down uh and then I someone can put that on on a instrument and begin playing that by reading the music other of us have to hear it others of us
experience it so again the sheet music is not the song the menu is not the meal right so models are always an abstraction of reality so they help us describe things talk about things but it is very different than the experience itself one of my favorite examples of this is from the movie Titanic where early on in the movie there's a uh one of the analysts is describing using the model and simulation how the Titanic broke apart so he's describing what happens and uh and then the ship splits and and sinks and you know and then at the end he says pretty cool huh he's talking to Rose of course who was on the Titanic
when it sank and she sees it responds uh thank you for that fine forensic analysis Mr Bodine of course the experience was somewhat different so for those people who have been through an incident who have had their organization attacked or have worked on incident response they read threat reports very differently than those of us who may not have experienced that same situation there's a lot of things happening that aren't captured or cataloged right how were emotions for the team what were tensions like what was communication like those aren't always captured and don't come out as opposed to those of us who read those Sports and they're like oh they dropped the sign driver an elevated privilege is pretty cool right
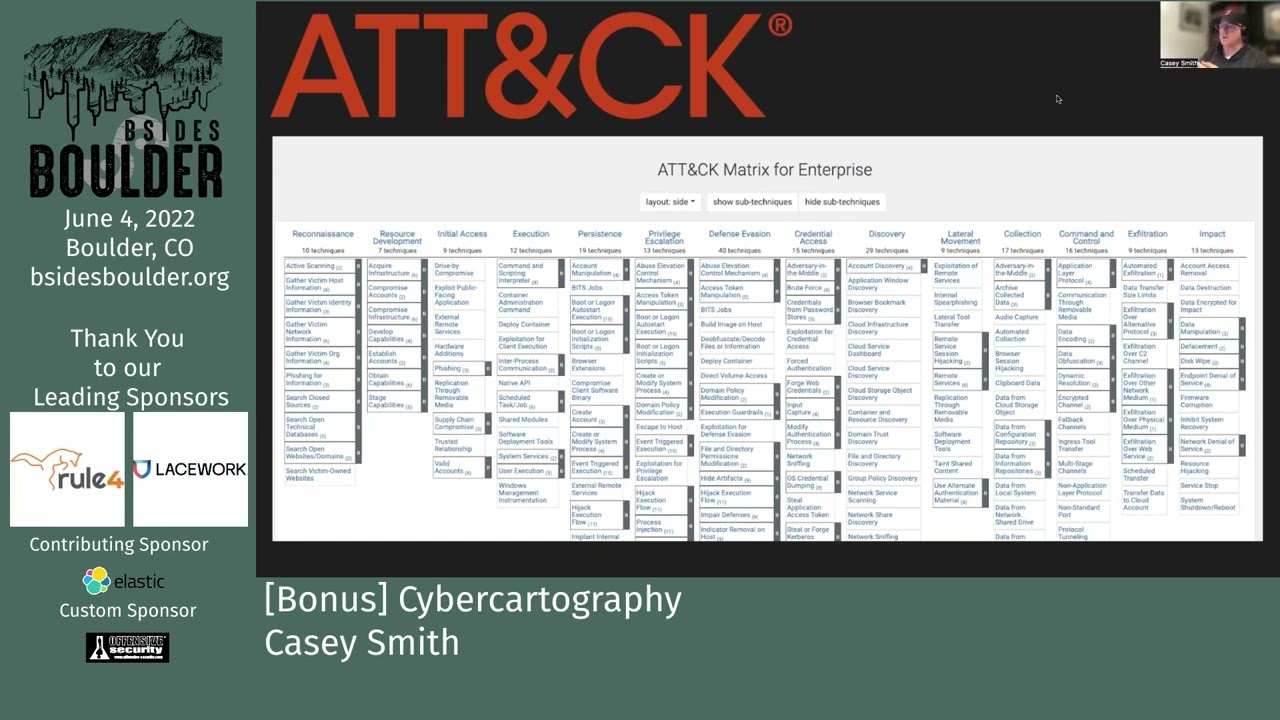
maybe but if you experienced it and it affected an outage in your organization may not be so just remember the model or map of a threat report there are people and organizations impacted by that actual report so when we look at models from miter like attack and defend these are a great way like music to in my opinion to communicate a taxonomy communicate things across time so it helps us look at something and say okay they did a scheduled task or they did this particular technique but again think I think of these as recipes right these are not the meal these are these are a way of describing something but there could be things we learn as we draw
closer to the reality and the whole situation much like the Mountaintop we can be looking at a map it's different than standing at the base and looking at the actual event so if you're not familiar with defend minor defend is a relative newcomer to matrices or taxonomies for various attack patterns and defending against those some of these we would recognize very quickly like say multi-factor authentication others of us would be terrified trying to inventory system firmware on all these devices and trying to understand how to defend that but the idea is it gives us at least a place where we can work from a measure of the terrain and know how we can improve so
these are really great hopefully you don't hear that I I don't like these I'm just trying to share how I think about these models sometimes another very popular model is minor attack and there's a matrix for various Cloud mobile these are really good at describing across the top these are the goals of the adversary so the adversary wants to achieve persistence at the top and how they would do that might be by going up the stack or using one of the items in that column to achieve that particular tactic so inside of each of these these are very helpful but again they don't necessarily describe the way we understand them when someone's describing supply chain compromise
I might think about that differently than you do and so also keep in mind this is very much like the model we have for Sheet Music some people can look at this and just play that attack out in their mind other of us other others of us need more context to understand what happened and to draw a new insight and observation to what happened so you might have a situation where on the left you see these are these are the directions the attackers went on the right The Blue Team scrambling or incident response teams scrambling there may have been a few points where those intersected over time where we may have been able to disrupt or prevent or block
Downstream Effects by the attacker but overall sometimes they're not things aren't as neat and they don't resolve into boxes uh as easily so keep that in mind as we go through this talk so you'll see various models presented for an intrusion that are well organized and cyclical and you know attackers don't do uh internal Recon unless they've done initial Recon for example so um that is one way to think about it another way might be there are a lot of entry points there's a lot of messiness to corporate and small business networks and there's a lot of places attackers could start and move what's important though is we have a an understanding or language this is actually from Matthew
Monty's book network attack and defense is a very good resource if you haven't read it I'd highly encourage you to take a look but a real operation may look very different from a defender or even from an attacker's perspective it's never as clean and easy as a simple spreadsheet so that's part one uh really talking about how we think about models and how they affect reality you know the map is not the territory there's a clear distinction between the two the next section I want to talk a little bit about is how offense and defensive tools need to share the same view and once that happens both attackers and Defenders can start drawing the same
conclusions or observations about what's happening and so if either side has uh an information asymmetry here that may help them right they may have a tool to see something that the Defenders simply don't or they may be aware of a blind spot in a tool that a Defender is not aware of so I use this example I'll call it cyberball it's essentially a soccer field on the left a basketball court on the right and over on the left-hand side these are Defender rules there's a lot of meetings there's a lot of can't pick up the ball with your hands uh there's different you know a goalie that's guarding the the net but over on the right an attacker has
really is none of these same constraints they could pick up the ball by their hands they could throw it around they could kick it they can uh they're trying to achieve a different objective than what's happening on the left side not a great analogy but this is sometimes how I think about I see a lot of attackers playing one game Defenders playing another game attackers playing the game of trying to achieve an objective or hit a Target Defenders trying to do log searches analytics and and uh they don't always line up and so it's almost like there's two different planes so hopefully bringing these two into alignment maybe at least is a theory I have that might help
organizations Better understand and model attacks and defense so when we think about an event what would an analyst need to see before an event during an incident or after that could help them understand it better can we use that information to replay to learn from for example why did it take us five hours to get the logs maybe next time it takes us an hour and a half next time it takes us 30 minutes is there a way to pause or look at our Telemetry rewind even train people on that so pause and analyst and ask you know hey what would you do in this situation uh give them a chance to think about it and and play it out and see
what happens so that's where I think models can help us ask these what-ifs run through these scenarios help people train but we think differently about a map when we're traveling than we do when we're lost than when we're just sitting at home uh and so different maps have different utility or models have different utility given the circumstances or the event that you're facing as a Defender I want the same map that the attacker has I want to know what they're looking at and try and outpace them or uh make decisions before they make decisions on the same information and cut off the attack so I might see well it's pretty obvious they're going to go after that bridge so we may want
to defend that area more heavily or whatever we're talking about but I want to hear the music I don't want to read the music I want to have the experience essentially that the attacker is having and looking at the network from that perspective to help inform where I need to defend so what can they see what can they touch or access those are the views that I want so some of you have used Cobalt strike before very popular red team adversary emulation tool very popular with actual adversaries as well and this is just a screenshot from their SMB lateral movement and you can see how an attacker could track which systems they've compromised you can see what the
Privileges like are they system are they uh just a normal user you can also track in the tool credentials that you've collected over time and from what source so this might be how an adversary sees an engagement and moves through a network and that may be very different than the way a Defender might see that same information uh Raphael has a really good talk called Flying a Cylon Raider encourage you to check that out if you're interested because he describes that sense of how do I take an attacker's perspective how do I look at an attacker's Tool uh and use that to help inform defense so really good stuff one of the tools that I like that I
think it represents this really well is a tool called Bloodhound and I think it shows very clearly the benefits of attackers and Defenders having the same view same information of a network and so Bloodhound if you're not familiar with the tool is a tool that allows you to model active directory structures to then find attack paths so maybe you're a normal user and you want to elevate to domain admin or maybe you have rights to this group but you want to elevate to another group it does it does quite a bit more obviously so I put some references here about how this tool has really changed our industry in terms of seeing active directory and really a big shout out to Andy and
the team that's doing this work because I think The attacker's View and the defender's view with Bloodhound is the same so the idea is we're looking at the same data and so we can draw conclusions about what we need to defend and how we can improve so if I can run Bloodhound as a Defender before uh an adversary does I may be able to quickly cut off places where they could Elevate privileges weaknesses we might have in our active directory structure so or configuration so so that to me that's an example of offense and defense having the same view and everyone getting better over time so another tool might be something like nmap to do Port
scanning or some some derivative of nmap we're both using the same things to scan for open Services try and fingerprint targets that is helpful to both attackers and Defenders so trying to find those places where the tooling provides the same visibility to both sides and we're starting to see this more I really like the team at Microsoft that's doing some of these visualizations so here you can see an attack from ransomware and you can actually start to see the flow of the attack mapped to various techniques on the right but you begin to be able to understand okay uh you know credentials cannot be dumped until security controls are turned off or until they elevate
privileges so we start to see the ability to affect Downstream Behavior by understanding the attack Flow versus just a spreadsheet or a chart so now we're starting to look for Trails uh on the map as opposed to just looking at the map together another blog from Microsoft is showing a similar thing now that all of a sudden looks a lot closer to the Cobalt strike view of the network and we could start to think about oh okay you know if the defender uh if they hadn't been able to reach uh node two then they wouldn't have nothing would have happened after that so okay lesson learned how do we iterate and improve so that I think has been very valuable
for attackers and to finish that the same view and so there's some examples of this that you can use to experiment there's neo4j which is a lot of the Bloodhound development excuse me uh there's D3 for JavaScript I'd encourage you to experiment and try some of the different visualizations to see what is surfaced or what uh might make sense there's quite a bit of templates and models that you can use to see what would happen and ask questions change the state ask the question again you know if we if we made this configuration change how would that have affected this incident you know maybe the whole thing was uh you know predicated on one thing
being true and if that was taken away uh everything would have collapsed and that's how we can get better over time by using these types of models to understand that at least that's my theory so what kind of maps do we have what kind of visualizations do we have in other domains in other disciplines you know how can we learn from those other disciplines what are the things that I think is interesting that other disciplines do is look at data across time so you functionally have how could we model a network or a device state or configuration over time and go back in time and look at State roll forward in time and see how changes play out
so if you think about meteorology or weather models and data you can see the value of these models is predictive right so I want to know what's going to happen on Friday so that I can make plans today and so looking at various trajectories inputs and knowing where models work and where they feel so some of you may be familiar with you know the concept of long-term weather prediction it's not possible I can't tell you what the weather will be like 10 years from now but I can tell you what it will be like 10 hours from now so understanding the value of these models and constantly changing inputs and seeing how that affects different
things don't I don't have an answer of what like a weather map would look like in terms of of cyber security but that's what I'm thinking about in terms of visualizations collecting some of this data and then looking at uh maybe what it's telling us is going to happen or could possibly happen in the future but so a great example of where we do actually use time and looking at data across time is time travel debugging this is my first experience of this was from a talk by Brett Victor called inventing on principle in 2011 and so he was giving this presentation and he was talking about how he was trying to get his character to make a particular jump
and rather than trying to pick the numbers he has a sliding bar but that was still hard to see so what he did is sort of turn on these Trails for the the character and he could actually by dragging the trails up or down play out a different future for the character until he got the exact amount and so this has been incorporated into a number of commercial products I'll show you in a moment windy bug a t train have both tools that use time travel debugging and these These are game changers for analysis because you can change input you can you can play out and exploit and roll something back change the state play it forward
again and see the effect and that is really remarkable so as we look at weather and how weather patterns can change over time we can look at the state of things even within a system even within a debugger and see how that would play out over time so when you think about reverse engineering and debugging you know a developer a reverse engineer they're trying to look at the same data they're trying to see the same things they use the same tools so an exploit developer can use a windy bug or other tools guidra Ida just like a software developer could as well so you can see here's an example from windybug moving forward going back in
time and I think the real value is seeing something play out back it up change the state play it again and see if it has a different outcome see if it actually made a difference so I like this slide a lot this is from t-train's uh website and they do time travel debugging and low-level analysis for like kernel drivers and things like that but you'll see here they can track reads and writes of locations to memory over time you can create bookmarks or uh snapshots you can then Trace those to a point in time where a write operation corrupted something that caused a crash and Trace that back over time and see where it came from see that it actually
came from uh the ethernet interface so these are things we haven't had so these are new so new models new maps new tools are going to give us new insight into how to defend and also how to attack so I like their stuff I think it's pretty neat another example that I've used is API spy and if you've ever looked at a you know you're in a debugger and you see a create file call and you're not sure what the function parameters are so your context switching between the msdn page and then you know what are the inputs here what does that structure look like I like API spy because I can simply hover over that
function call and it will show me right away oh okay I can see that first parameter is a pointer to a string or whatever it might be so that gives us a lot quicker Insight a develop an intuition for maybe what's happening as we're troubleshooting something so some of the best tools for troubleshooting and debugging can be really helpful for informing what we know about security incidents and situations how we see things then this is sort of my point helps us make predictive and analytical and strategic decisions so if an attacker is seeing something that I don't see they may make a different decision than I might make and so while there's always that element of human
adaptation and Innovation um we want to be more informed than the adversary we want to know things that they may try we may want to anticipate or disrupt their attack early in the chain and we can't do that if we're looking at a map of Paris you know trying to defend Texas okay so uh what we can we can predict where things are going our models can inform us uh you know what questions we need to ask Etc so one of my favorite tools uh for web application testing some of you are familiar with this would be is burp suite and I love the burp Suite interface the the plugins the whole thing it's just very elegant and it
allows me to then see the request and the response parse the headers look at different parameters we play attacks uh fuzz or inject things at a particular point in time very very powerful offensive Tool uh to to go look at and start testing web applications there are other web proxies that inspect data like Fiddler uh o wasp zap proxy uh Charles proxy uh mitm and in Python but this is an example of seeing the data and then that informs our defense so by running scans and running attacks you know we might see that oh for this particular method call if I just count the Response Code so Response Code 500 means the application couldn't handle it
and something crashed in either the gvm or the the web server so those are important and we can see an asymmetry here between you know get requests causing a 500 or a crash versus get request causing a 200 and we may want to look into that so I guess my point being here is I would really like my wife to look more like burp Suite right so if those are two different tools or whatever you're using to defend your website the closer uh the view of you know can come to looking more like an offensive security tool I think we're going to see dramatic improvements and insights we're already starting to see that people using application monitoring
data to help inform their defenses so we could look at got a parameter over time and say like it's only ever a date if it's something other than a date whether it's a semicolon or a apostrophe just kill the connection because I know that field should have always parse or why you know why is it a date 99 of the time and now all of a sudden it's adjacent objects or yaml so that tells me something's happening there either a misconfiguration or somebody is sending those events so anyway hopefully that make you make it gets the point across like as a defender of web applications one of the advantages you have is all testing and all attacks are for the most
part visible if you're have the right verbosity and logs turned on so you get to see all the failed attempts before the attacker actually may succeed not often but uh sometimes so another um example for you just I'll just leave this up here for you uh to reference this is a visualization tool using kitra and it allows this situation the analysts to really just scan through the data and all of a sudden some things start to to pop out uh as or that maybe that's an image maybe maybe that's another type of structure that's just a text string but then we're leveraging the power of the you know human brain to see the patterns here
while the computer can then surface the data so sort of combining the two strengths of both the computer analytics and the human pattern recognition to find something in a file that we may not that may have been difficult to to find otherwise and if you like adversarial thinking or red teaming you can use this same approach as well you can think about well what does a Defender see what would they actually observe and I like this painting called Another World from MC Escher which shows three different perspectives the same frame but it actually takes your brain a little bit of time if you pause the video and try and figure out am I looking I'm looking up but I am am I on
the left or am I on the right and I'm looking down and am I on the right or the left and so those kind of contexts which is slow us down can slow us down and so how can we accelerate that but you might think about as an adversary uh emulation team or red team like what would a Defender see here and how could I either try and camouflage my activity or how could I you know try and blend in so when we talk about other domains disciplines so what what can meteorology teach us about you know cyber security what can an astronomer teach us about cyber security so you think about that for just a moment some of you will
recognize where I'm going with that the idea was from the book cuckoo's egg where Cliff Stole was a astronomer that was called in to respond or essentially ended up responding to a pretty major cyber event in the late 80s it's really good read lots of good history a lot of good approach and techniques there but we can learn a lot from other domains whether it's meteorology astronomy or excuse me medical Aviation Public Safety all those a lot of these problems people have solved that we may not be aware of and there may be techniques we could use and apply to cyber security in the models we use in the database service so another reference is Carmen Medina's
talk uh keynote that she did about diversity of thought and inclusion and different perspectives on solving problems and she mentions one of the astronomers here Cecilia who by looking at things like photographs from telescopes was able to infer makeup of stars and it's really fascinating look not only at the science but also just uh you know what she had to overcome to to understand and and reach those conclusions so the way the way we look at things and understand data may give us new insights so in this particular part of the talk Karma was talking about the benefits of combining telescopes and photography because up to that point it was just somebody's you know uh someone's word that they saw
this thing at a particular time but with a photograph or a recording they were able to then other people could study it and draw other conclusions so how does that help us with models and cyber terrain well we may if we think about telescopes and photography you know what do we need to combine uh with cyber so I you know I don't know this is just an open question but like you know what how could you combine cyber security with Zillow or something you know or or how could you combine it with a recipe site or drone perspectives or whatever you bring to the industry and your perspective may be really valuable for us because we may be missing
something but things that might help us think about this be like what takes a lot of time today what's expensive today what's tedious or error prone today how do we reduce that improve that improve the quality those types of things we may draw from other domains so some of you may have heard of the ooda loop and some of you may roll your eyes and stay with me but the idea of the ooda loop here is observe Orient decide and act and so this originated in the Air Force pilots looking at how to become better pilots and how to win uh in dogfights and how to gain an advantage over adversaries and and some theories are a lot of it's
related to like the canopy or the bubble Pilots had a different view than their opponents and so this old movie from uh with Clint Eastwood the original Firefox if you remember you know he has to steal this plane and in order to do that he has to think in Russian uh so pretty cool you know original Firefox before the browser but the idea here is UDA is probably best experienced and taught it's sort of like trying to describe to you how to play the piano versus letting you play the piano and see what that's like and then you'll begin to to build repetition so let me try and explain that how I think about UDA and
how I think about faster Loops so going faster from observe to act is how I interpret that and and that improves that our Speed and Agility as Defender so one problem that you might have is imagine you're a large organization and you identify in your proxy server logs a malicious domain was detected somebody tried to browse to a malicious domain so now you have a lot of questions and how fast you answer those questions May inform the scale and size and duration of the incident so once you understand there's a malicious domain in your logs you have to ask how did it get there which hosts performed the lookup you know was it just a lookup of a DNS
name or did someone actually send an HTTP request to that domain and if if it was a lookup who performed the lookup a proxy server or a domain controller um there's a lot of questions right and so then we may want to go back and say all right now that I know that it was computer a what was the process name on computer a that performed the lookup was it a browser was it maybe just a you know someone typed something in wrong was it an injected ad or was it SVC host what's the user agent if it's an HTTP request there's a lot of things here just by seeing a malicious domain in your proxy logs you have to go answer
and then once you've answered one and two you now have to sweep the organization and answer that for all of your hosts has anyone else talked to this domain has any other process talked to this domain and then you repeat that cycle and so that's the loop right that's the observed act and so by doing that in 12 seconds versus 12 hours how quickly can you reboot eradicate clean up machines versus something that may have persisted in your network for a very long time so by increasing the speed that our questions are answered we can influence our ability to defend the organization so that's how I interpret uh some of the UDA models and things like that I see
value in it but I see value in it in terms of doing it instead of just trying to describe it so but by understanding how quickly you can answer questions that makes you faster right so if I can pick up an enemy uh aircraft 12 miles before they see me that may change you know right that all of a sudden you start thinking of where this comes from that may change how we react so the speed with which you ask and answer questions may affect outcomes of incidents both at attacker or Defender and asking and answering faster than an adversary may be something that you'll strive for how quickly could we answer that question what tool do we need what do we need to
turn on in our logging to be able to do that faster so so that's Buddha if I think about observe Orient decide and act it's a lot easier to do it but also if you break it down then you can ask how could we do this faster so what's an example of this maybe that's where EDR uh could help you right so you have a tool that now tracks every computer every process and every domain they've talked to and now you can answer the question in 12 seconds versus 12 hours versus 12 days so that's where I'm going with these tools can and models can help us improve our defense overall back to earlier when we were talking
about drawing on other disciplines so if we think about like telescopes and photography being combined what could we combine EDR with so EDR by itself could actually maybe be a force multiplier if we combined it with something else so what about fraud analytics and this is just pure speculation but you could say like you know how when I buy a credit card you know buy something and it's not me the bank calls me or sends me a text and I say nope that wasn't me what if that was possible with EDR so what if you know your EDR system detected wmi spawning a command prompt and the user got a push notification hey are you
running command no how quickly could you then react or respond check with the user give them a call so the the data then can be uh inform us and that model that helps us get really quick so we can deny the transaction in a few seconds or we can recognize this holiday season and yes that person's buying a TV or it's the end of cycle maintenance and yes they're running wmi and we get better over time but just simply asking a question might be a way to improve the process so hopefully that makes sense so just just combining ideas like that like how could we you know use a fraud notification in the financial industry and combine that
with endpoint telemetry I don't know another thing you might do is enrich the context or the data that you're presenting so if you look at a other graphs you might just see nodes but here an analyst can actually see a keyed map and they can actually see the data oh all right that's a file right that's a file modification that's a process spawning a network connection so by seeing the relationships and quickly understanding that may help an analyst pivot to another tool that shows them oh I need to go look for any exe file in the app data local temp file or with the name temp in it or maybe I need to go look for any executable that has a
single letter so like show me every executable that has like e dot exe almost always evil so that is from JP cert they have a tool called syspon search that kind of enriches the view so trying to draw from different visualizations we've looked at Bloodhound active directory we've looked at debuggers we've looked at burp Suite looking at endpoint data so hopefully this is connecting with maybe some of you different visualizations of giving you ideas about how these maps and models improve our understanding I like this one uh from Edward Tufts he has a class I'll reference at the end about data visualization and modeling and so what we want to teach folks or what I what I think we
want to teach people is how to react and adapt to situations and use the tools that they have so if the thing I like about this is here here I am looking at the dishwasher Matrix and I if I have a number five tablespoon in my hand I don't know where it goes there's nothing on this it tells me so what do I do with this tablespoon that doesn't fit the the grid and so that can help us you know how we're using the tools so I much more want as a senior or principal and training new analysts I want them to be able to adapt and react much more like um maybe a surgeon does
where we're training them you know C1 teach one do one so to speak where they're getting the Hands-On practice maybe guided or in a controlled environment but it's not enough just to give someone a matrix and just say go hunt it's just like giving somebody uh an anatomy chart and saying go do heart surgery so there's got to be a way to train people there's got to be a way to use these models to help people learn over time one of the books I like is by Dr Atul gawande who wrote a book called complications that he actually wrote while he was a Surgical Intern that talks about this it talks about the challenges but we need to teach people
to to do the work and be able to adapt and provide feedback if the tool is not working that needs to be something that they can provide to us so again trying to draw from a domain like medical training or surgical training how might that inform how we train security analysts we don't just turn them loose there's more of an apprenticeship and working together to both learn because the senior or principal or role can learn from someone with new perspective they could be like why it takes you like seven steps to copy the you know event log domain into the Sim why don't you just do this so it's mutually beneficial so uh or building muscle memory so if you
remember in the Karate Kid towards the end early in the movie rather uh Daniel has been doing all these this work he's been sanding floors waxing cars painting fences he doesn't really understand why he's doing these various things until Mr Miyagi starts doing punches and kicks at him and he realizes he's learned by wax on wax off he's developed muscle memory to respond and react to these things so we work on the models we study and understand but ultimately it's the experience of the thing that is going to be how we use these and how they help make us better and improve our understanding so okay so some closing thoughts uh our tools our Maps our models they matter
we've covered a lot of ground we've talked about how the map is not the territory we talked about combining tools so offense and defense have the same view we talked about different Industries at different parts of cyber security where that's true things like debuggers time travel debugging uh web application attack tools Bloodhound Etc I want to close with this and I think this is an important concept is that you get what you measure is a quote from Richard Hamming and essentially he tells the story where the fishermen go out and they catch fish in the Nets and every they conclude that there are no fish smaller than a particular size because they've never seen them in the net and
so the takeaway here is the instrument affects what you see the size of your net is going to affect the size of the fish you can catch um seems obvious sometimes we forget it hopefully that's a good reminder and another quote I like from Carmen Medina is our ability to know as a function of our tools for knowing so our ability to combine telescopes and photography is going to improve our understanding over time our ability to take cyber security tools and models and map them over time helps us see things so okay we covered a lot of ground thank you for uh bearing with me through that hopefully this was informative there's some references for minor attack and
defend uh one of the plugins in miter calderas game board which is trying to do something very similar to what we describe where offense and defense have the same picture and a lot of my thinking and ideas that around these visualization came from a class that I took uh Edward Tufts course on visualization is outstanding if you want to take it it's super fun and hopefully we'll we'll bring new ideas so looking forward to those of you who are new to the industry and those of you who are seasoned veterans how what we can do to learn from each other and draw from various domains so thank you for your time and I look forward to seeing you
all in person and hopefully you'll have a good rest of the event
Related talks
 51:24
51:24 47:43
47:43 49:58
49:58 40:48
40:48 47:32
47:32 49:19
49:19