Analyzing volatile memory on a Google Kubernetes Engine node
Show original YouTube description
Show transcript [en]
my name is Marcus I work for Spotify security team and I'm here today to talk about how we can analyze volatile memory on a Google kubernetes engine node so this is the quick introduction for myself I work as a detection engineer at the Spotify team I'm a big hiker folk dancer and traveler like to do rock climbing one of my secret skills that I was asked to put here is that I like to mimic accents something that drove my mother insane when I was a child and something that I still do so if you hear me do it just tap me on my shoulder and I'll try to restrain myself quick disclaimer here as I said I work
as a detection engineer so I'm not a colonel or kubernetes expert so some of the things I will show you here today is part of my own work at the company and I hope this can provide some value for how we can analyze memory in GC and GK nodes and if you have other people here in the room I think that would be great to add to that conversation as well so feel free to ask questions speak up let's make this a joint conversation everybody happy all good okay let's take it away so quick agenda so I'm going to start off with a quick summary or too long didn't read type thing just make sure
we're all on the same page what this talk is going to be about I will then cover some of the things about how we at Spotify manage container workloads and then do a high level introduction to Google kubernetes engine or gke then talking a little bit about the kernel and why that's interesting for this use case and then ending with What are memory snapshots and how can we use them on gke notes using open source tools which is part of what I built together and I'm going to end the talk with a demo I'm going to also be publish some of that code for later so you can all take part of that if you want to and
yeah that's the journey and I know I'm the only guy left before lunch and I know you're all tired after all the good talks so I'm gonna try to make this a bit energetic so we all feel a bit enlightened and then we can head off and have some good food together so quick agenda so what is the summary that on this talk so the only thing I want you to take away from this talk today is basically how we can access volatile memory on a gke node which I'm going to show you how we can do I'm gonna do that using three open source tools called volatility three dwarf to Json and avml and combining
these tools together using a script that I built and spinning up infrastructure using terraform I'm going to show you how we can analyze all the running processes and memory on a live gke node in Google Cloud so let's talk about how we manage container workloads at Spotify we are a big company and we are very much involved in running our infrastructure in gcp we operate in more than five gcp regions across the globe we run up to 4096 nodes per cluster and we have hundreds of production clusters running simultaneously every day we have more than 4 000 services that are live in production spanning more than three thousand namespaces and providing that all together is what
builds our services to our customers so taking it from there to Google kubernetes engine can I see a show of hands how many people in here have worked with kubernetes or gke overall perfect this is a great crowd how many work would that say on a daily basis in production environments oh still a lot of good hands perfect so just to kind of level set this a little bit and make sure we're all on the same page I'm just just gonna do a high level example vacation here of the vocabulary that I'm going to be talking about so for those of you who are familiar with this already there's no news but for the rest of us when we talk about
these things in gke we have for the beginning a cluster so a cluster spans a lot of different notes where a node is basically a cloud instance running so one cluster multiple nodes running that so apart from the nodes which are the actual Cloud VMS each of those nodes can have several namespaces where the production load is running now a namespace is a way to isolate resources so that you have segmentation between the production environment as it's running on the same node so on the same node you can have multiple namespaces with multiple resources running in parallel but you still have that segmentation and isolation now on each node we have one or more pods which is the smallest amount of
resource we have for an application each pod can contain one or more containers where a container is basically the executable image of all the software we need to run our application and you can have one or more pods and one or more containers for each pod that are running simultaneously in these different name spaces so showing your high level picture here of what a gke cluster looks like we as the users and operators of the production environment will be accessing these clusters using cubectl which is basically a wrapper for the API server now in order to manage these nodes across the Clusters each of these nodes need to have a control plane in place to
First interact with and level set so we have that interaction now that control plane together with the API server basically controls the resources that are running on that cluster scheduling the different pods for the production environment making sure they are running as they should and also keeping track of how much storage is being used how much memory how much CPU Etc so that control plane is basically our brain for understanding and managing our gke environments now we mentioned that in a cluster we have one or more nodes which can run one or more pods with one or more containers inside of them so with that segmentation we have all of those running as part of our production
environment and interacting with the standardized Google cloud services such as VPC networking disk load balancing and other Cloud operations that a cluster needs to get access to the outside world and to manage our infrastructure and as you see at the low level here with the labels some of that is managed by us as operators of the infrastructure and other parts of that as here on marketing green is managed by Google themselves so with that high level understanding of kubernetes and how that works in gke let's move into the next section what is the kernel and why would we talk about the kernel in this case how many is familiar with a kernel definition by the way
cool I have not asked chatgpt what the kernel definition is so I'm gonna use a different analogy here but I'm sure we could have tied that more into the talk afterwards as well and see what chat GPT would have given us so at a high level and to summarize a kernel is basically the interaction with our application and the underlying Hardware so in order for any application to work it needs access to storage Network CPU Ram all those things which is on the backbone of that infrastructure that the application is running on so essentially the kernel provides all of that intermediate layer to make sure that our application is running as it should on the underlying Hardware using
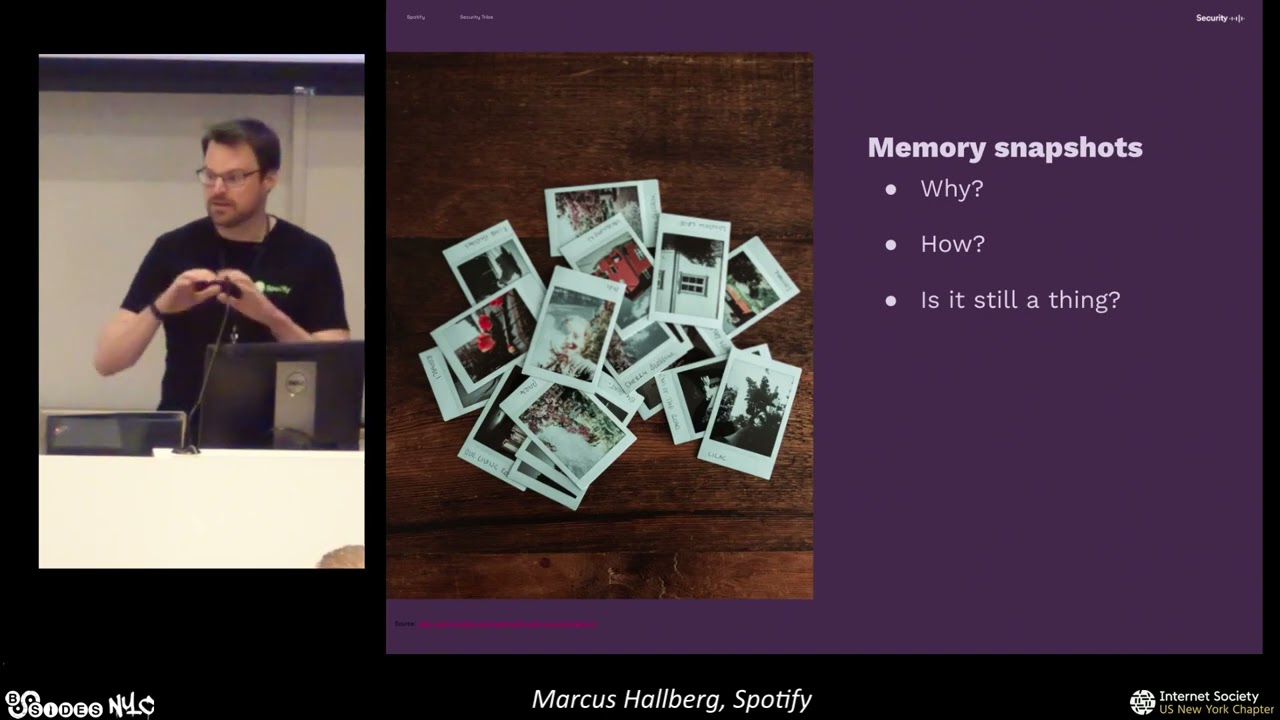
system calls so if that is the purpose of the kernel why is this important or interesting so if we can understand and get an insight into what is happening inside of the kernel we can essentially understand what happening across that entire infrastructure so you can see all the processes that are running you can see all of the underlying file systems that it's being interacted with and we get basically that really interesting glance into that infrastructure for what it looks like and what production environment is running moving from the kernel to talking about memory snapshots then so what problem are they trying to solve with this what is the purpose so essentially one of these problems
that we find they're interesting and we have production tools for monitoring this today is how do we know what a user did after they accessed a container so we might have some understanding from the logs we might do say disk snapshots or look at Network traffic but we can also have that extraditional insight into what the user did and what processes were running before or after a user accessed a container so that's essentially what we're trying to solve and as the picture here shows I'm sure all of us seen here or at least some has been in that position we're like yeah something weird happened here's a bunch of logs go and search through all of
this I see some few some of you are nodding I've been there myself and my colleagues as well um so this is where that additional Insight of using memory snapshots can become interesting now it's it's important to say that the approach I'm going to show you here today using open source tools and using memory snapshots is one way to get that additional insight into a gke node now there are production tools available that are running this already today where you have a streaming Telemetry and if you're already using those I would say that's fantastic and you should keep using these this method I'm going to show you here is providing an alternative approach using open source
tools which you can use for comparison so with this problem in mind what we're trying to solve how does memory snapshots then help so why would we then take a memory snapshot so in memory snapshot just like the name sort of indicates would be one way to have a photographic piece of what was happening at a specific time on a specific infrastructure or server that Insight together with other insights like the disk and the network activity and the logs can give us and paint that full picture on the puzzle of what was happening at a certain point in time after a user did some type of activity how then can we get memory snapshots well this depends largely on the tools
available there's a lot of them out there but it also depends on what type of infrastructure that you're running and what you aim to do so in the gke case which is running cos which is container optimized OS you could not for example use kernel modules because you cannot build them from the source inside of the GK node itself so if you have say a different server where you can have a kernel module that could be a great way to get that memory snapshots but in other cases you need to rely on different methods and the one I'm going to show you here is proved to work quite well for gka nodes so our memory snapshot is still a thing
right isn't streaming Telemetry a lot better I would say it is but still memory snapshots can be a very good complement to that additional data memory snapshots are still being taught by a lot of the courses around the world using different tools at disposal so I would say it's definitely a thing and it's more about how you use them to get it with your other tools in your tool stack basically so in summary what are the use cases for taking a memory snapshot on a gke node I would say it's a couple of ones so first of all if you have no other solution in place to analyze volatile memory this method that I'm going to
show you here can provide that type of insight again if you have other commercial tools to monitor containerized workloads perfect keep using them use this as a compliment if you will and have that additional insight another use case would be for portability so in this case the format I'm using is called line format which is open source and portable so you can use different tools to analyze the memory Dom once you actually have it in this demo I'm going to do a Showcase of volatility free but the same format applies for other tools as well so the third one would be also if this is a single exercise so let's say you would like to have some type of
troubleshooting or under extra understanding of the single point in time of what is happening on your gke infrastructure so you might not want to deploy a complete tool set across your entire environment but say like oh this gke node here is behaving a bit weird I would like to understand what is running on that at a given point in time for that this could be an interesting one and lastly as I was sort of highlighting as well if you have other tools available this method could be good for comparison or for troubleshooting and what that will look like I'm going to show you in a bit foreign so we talked a little bit about how we
can create memory snapshots using the different tools now for gke specifically there's a couple of constraints we need to be aware of so in summary in order for us to do this we're going to need three things we need to access kernel live memory and get a dump of that and for this purpose I'm going to be using a tool called avml that was originally written and built by Microsoft but is today open source secondly once we have the kernel memory dump we need to build a simple file to interpret that memory Dom too so we can understand what is actually happening inside in order to do that we need a VM Linux file which is essentially the
unencrypted binary of the kernel itself so that is basically our map to understand what is happening inside of the kernel using the kernel memory dump that we have step three we're going to put all this together using a tool called volatility three anybody in the audience worked with that tool before cool a couple of heads and taking all this combined we're then going to be able to understand what is happening inside of a gke node so how do we do this so first of all if we have um the memory dump how do we get access to that so in this case what we can do is we that we can access this part of the file system under proc
slash kcore so what is that basically it's a file that represents the whole physical memory of the node that is running and it's in the elf core file format so the length of that file is basically the corresponding physical RAM size plus an additional four kilobytes now with that in mind I'm sure you understand that if you're running a large production node with a lot of RAM on it these dumps are going to be sort of big which is why in this case avml kindly enough provides us a compressed format so we don't need to dump the whole thing we can dump it in a compressed format for later analysis so how do we get access to this file
system as I'm sure some of you know you're not supposed to access host file system from inside of a container right that's pretty bad so what we're going to be doing is that we're going to deploy a custom privileged container with access to that file system on the GK node once the dump is complete we can remove that container and it's only live on that node during the time of when that memory lamp is being carried out what I'm showing you here as part of the picture is the definition of that privileged container using terraform which is what I'm using to spinning up the infrastructure for my demo so we talked about getting the kernel
dump and getting access to that step two we need to interpret that memory lamp as well so the easiest way to do that is using a tool called dwarf to Json where we can build a simple file using the VM Linux file which what I mentioned is the unencrypted binary of the kernel itself right now how do we get access to that that's a tricky one has anybody worked inside of a GK node and tried to find this file in any file anybody tried to do that No Hands okay it's actually present on the host file system but it's not the accurate one it's not a complete one so if you try to build a simple file using that it's not
going to give you a correct interpretation of the kernel but what we can do instead and this is one of the things I found when I was doing this research is that since we know that all of the gke nodes are running cos there's a standard for that image and there's a standard for that kernel itself so if we know this is how cos is being used could we find which kernel was used to build that image and it turns out that we can so if you look really closely and I'm showing you here this screenshot from my own gcp environment if you look at the build name for the image there's a section in
there that actually discloses the build ID of the COS that is running on that UK node so now that we know the build ID and we know which version of cos that is running on the gke Node it turns out there's an actual way to access the VM Linux file this part was quite tricky and I had a lot of interactions with some great people at Google around this and it turns out there's an actual open API that you can use if you have the build ID to access the raw VM Linux file I haven't finally documented anywhere um so I don't know how public this is um I have talked to uh said googlers and
I had the permission to say this here today which is good um but uh yeah it's there like if you know where to go and find it you can actually pull down the VM Linux files on any cos instance that you have running uh knowing the build ID and since Google is kind enough to disclose the build ID in the image name we now have a way to Pivot from the node to the COS build ID version to the VM Linux file and thanks to that we can get that file and now we can build a simple file of that entire kernel that is running on our gke node that's pretty cool so the testing setup that I'm planning
to using here today what does that look like so using terraform I'm defining my resources in a gcp project I have a single cluster running in the US West one region it's running on one single GK node with a couple of different pods associated with it these parts are running in different namespaces to make sure we have isolation between them and two pods here for the demo purposes are specifically interesting foreign s is called the attacker pod or operating from the attacker namespace it's nothing more than a custom built Docker image that I have where I've deployed some of the tools I want to use inside of it and what we're going to do is that we're
going to be accessing that attacker pod here on the demo and run a series of commands and other things inside of that to mimic a malicious Intel secondly we have another pod which also is built on top of a custom Docker container that has avml installed together with some other tools in order to access the memory lamp now if you remember I showed in one of the previous slides that this pod the avml Pod is the privileged one so this one has access to the host file system and can so access the kernel space which is what we need in order to get that memory done now since we also know what the name is
of this gke node we can pivot from that name to the image that the node is running and from that image and build ID we can get the VM Linux version so putting those two together we have the information we need to get that out and then start analyzing that so for the demo purpose I have a python script that connects first to the attacker container it runs a certain number of commands I'm going to be doing some live commands here as well on screen it then accesses the avml Pod and runs a memory dump of the kernel space which it then uploads to a GCS cloud storage bucket from there we have a forensic compute
engine which is connected to also by the same python script that is pulling down the memory dump it then queries the Google API to get the codes build ID and it downloads the VM Linux file from the open public API that was showing in the previous slide so with all of that together we can then run that analysis on the forensic engine using these three things let's do a demo and let's pray to the demo gods anybody in here had a fail demo before lovely we're all in the good company here then cool I'm gonna be jumping out of here a bit and into my terminal
can everybody see that text okay is that big enough or should I make it bigger a little bigger we're gonna be out of the screen soon is that okay thumbs up everybody in the back too cool let's make the same one for this perfect so what I'm going to be using first is that I'm going to access the cube CTL command and then access the attacker pod that I have so um people who know and work with cubesatel before I've already set up my credentials so I have access to the Pod using my gcp principle and now what you see here on screen is that I'm inside of that pod running on the GK node that I want to analyze
if I run a quick LS you will see I have a couple of scripts here one python script and one bash script and this part is now started from the get-go so it hasn't hadn't done any activity before and it's basically if we take just to copy the history here real quick we can see that we don't have much in bash History either so what we're going to do now is that we're going to run this script called actions.sh and with that it does it's that it's a few simple commands that I'm running interactively as some of you know if you don't have the interactive setting the bash scripts don't log to history by default so in
order for us to populate the history here a bit and actually see a bit of actions this is why I'm set up the script in this way where I have a couple of different commands and I'm going to be running so if we take that out and then we check what are the running processes here as of now we don't have much we have a couple of things here this image is based on nginx I should say which is why you can see that activity right here but other than that there's not much happening so let's go ahead and run this command script right here and see if something happened to our processes so now we see a new active one here
which is basically a watch command that I've set up to Pivot using curl to get the current IP of the ZK node so this one is just pivoting out to say like hey who am I where is this and it continues to do that again checking history we don't have all the new commands applied yet because we're still in the active shell if we jump out and back in again we should see story that's a new one right if anybody wants to do a pull request for that I'll be in major support so now you can see the commands that was inside of the script that have now been added to the bash history so we have some commands being run we
have the new process thanks to watch this active now let's do an additional one so I also have mentioned I have a python script here and this one is quite long so I'm not gonna explain right now what it does but as we run the python script from outside we're also going to be seeing this script being active and I will ask you what you think the script does so we're active inside of the attacker pod let's run the memory dump and see what we can find out
so what this group does is a couple of things it first creates a precise URL that we're going to be using to upload the memory Dom to the gch bucket that is only active for a few hours in order for this to run I then access the attacker pod where I run the script that you saw me mentioning before and I'm basically dumping all of the outputs so we don't have to take that into consideration now if you see here I exited the attacker pod and I went back into the avml Pod where I am now running the memory Dam using abml this takes quite a bit of time depending on how large your node is and also the
difference how the how the size of the memory dump will also differ so I run this in our production cluster as a test and in here I'm using an isolated gcp product for the demo usually it lands somewhere between 800 Megs and 30 gigabytes depending on the Node level but of course as we mentioned since it depends on the proc slash cake or format which again depends on the RAM and the activity there's some consideration here that I'm going to get back to what you need to think about if you want to run this in production so the memory Dom finished and just to make this one a little bit quicker as the scripts here finished I'm gonna
cheat a little bit and I'm gonna go and jump into the forensic engine and show you a test that I ran this morning to make this a little bit faster so as you can see this one is currently being run and active so if we take a look at the output from one of the previous tests we're going to see a couple of things so I'm gonna do this and let's go into this one yeah
so basically what we have done then using the script is that after we get the memory dump we're gonna decompress that inside of the forensic engine now I mentioned also that thanks to the coast version and the build ID we can get the VM Linux file and build a symbol file which is also happening in the back here so down here in the script you can see that I now accessed the API endpoint I get the VM Linux file and then thanks it works to Json I'm now building the symbol file using that up here all of that has already happened and I have also run the analysis on the memory dump using volatility free and
here's some of the examples that came out so for those of you who have worked with volatility 3 before you know volatility 3 has a lot of different plugins that it's using to basically get things like the process tree uh the current aisle files being mapped to processes uh what modules are being loaded at this time Etc so just to let this one finish for a bit and we're going to see a similar result but to get the summary I'm going to jump back into my slides and show you what we can find so let's say that we have now succeeded and this little guy here is happy this is a video I recorded if the we
would not be praised by the demo Gods so thankfully we were so in summary then what have we done we have done a memory done from the proc slash kcore file in the um on the JK node host file system we have obtained the VM Linux file and built a symbol file using the work to Json and we now have all of the components needed in order for us to analyze this using volatility free so if we run this using volatility 3 what are we going to see actually so remember we had a GK node with several pods in several namespaces that are all running on a production node isolated from each other so a couple of things here so first of
all we're going to see The Bash history from inside of the attacker container now this is using the bash history plugin from volatility free and although this on here shows some of the commands that you will recognize from the script that I ran inside of the attacker pod um this module or Plugin from volatile 3 is very tricky I would say um I've done this test in a couple of different combinations probably 50 times and it's really hard to get the complete bash history so I don't know if anybody in here is a like good expert on how the bash plugin Works under the hood but it seems like there's a lot of dependencies on what
commands did you run were they interacted did you exit the shell or enter the shell before you ran the memory dump Etc so what you can see here on screen is the best case scenario but I would not use this as your main source from truth to understand oh did somebody run a bash command like did they or did they not because in all likelihood if you didn't do the memory dump at the exact right time this output here is going to be empty so that's something really important to take away but apart from bash history what can we get well down here we actually have a couple of other plugins that are great so let's
start with the process list now some of you will probably remember that we had the watch command being run inside the attacker pod once we had finished the script right and we can see that process being active here together with python sh NC and also avml which is all active at the same time on the production node anybody knows what NC is that cat exactly so pivoting from the process tree uh sorry the process list and we get into the process tree we can actually see some more interesting things so if you look at this list right here is the text Big Enough by the way can you all see that in the back no
let's see if I can make that a little bit bigger I'm gonna be doing a live edit here but hopefully it's not too bad nobody remembers a coward right okay is that better yeah Okay cool so what I want to show here and the reason is that you will see there is a hierarchy called oh that's a long word there's a hierarchy difference sorry part of my English uh between these different processes right so you can see that watch and python are running on the same level but you will also see that sh and NC are children on the python process so knowing that we have the script inside of the attacker container that was going to run we can now say that oh
this looks like to be part of that script output right and I can show you or I can tell you right now what the script actually does is that it's creating a um mesh script file where it downloads and then fires up and netcat listener it then removes the file but the process is still acted which is why you see that still in the process tree even though the file no longer exists so this is again a good example of like comparing say a disk image snapshot to a memory snapshot because you wouldn't see the file there at this point but netcat is still there and active and listening in just like the watch command is
now if we come down here and I realize this text is again a little too small so I'm gonna try to say maybe I can do it something like this here we actually get the full process information so not only do we see the watch command in its full as we saw from the bash script but we can also like see how python was being executed and the shell being active for this one called the malicious scripts so in this case the malicious script that's actually the script which fires up the netcat listener and then it removes it so you will still see it active again in the process but the file is no longer there
and down here below you will also see the actual netcat process being active at the same time and last but not least here at the bottom we also see the avml process being active in the other container so again using the memory dump at the high level here on the gke Node we now have a full understanding of all of these processes that are being run at the same time across the different containers and paths apart from this example there is a couple of really other useful things that volatility 3 gives us these plugins are all available and working as well in this demo and I'm going to show you some of that in just a bit
but we can look at for example the map l f files we can look at the kernel modules being active we can look at the mount points TDY Etc so there's some really good information in here that we can use to understand and analyze what is happening inside that gke node so to kind of wrap the summit summarize we saw the running processes we saw what they had been doing sort of now if we would not have had this at our disposal how could we have figured out what happened right so as you saw in My Demo I was accessing the Pod using cubectl I was running a bunch of things and then I exited and I came back in
so what does that look like from the log side so as far as I know and I might be wrong here but there aren't ways to get the full extent of a cube CD Alexa command in the DK logs the example I'm showing you here is a standardized format where you will get a log that says oh this user here accessed a pod using cubectl and executed something what that is we don't really know other implementation kubernetes offers that through the request URI where the IPA server actually discloses the exact exact command if you run that locally if you only run say uh you know bin bash to get a shell and then you run everything
else interactively inside of that container that is still going to be missing so this is where the piece about memory lumps and analysing the GK nodes is really interesting because it gives us that extra context where we from the logs would have just said oh somebody did an exec what happened after or what did the user do that's hard to figure out right um again I'm hoping that there are more extensive formats for logging in JK I haven't found those myself if anybody here knows if that logging is available I would be happy to hear that but from what I've seen this is the standard login you get if somebody accesses and executes commands inside of a container
so what have we learned what are the Lessons Learned here so a couple of things right so when you run something like this uh there's a couple of pieces to keep in mind so even though we Define a privileged pod and container which has avml inside of it we need to be very mindful of the resources that that's going to use if you remember the picture I showed you earlier in the talk about the resource controller and how the control plane is keeping managing of the Clusters and the nodes the resource utilization here is one of the key pieces so if you say consume more CPU Ram or disk than you are allowed to you're basically being thrown
out of that node also if there are resource constraints on the Node itself your pod can be rebalanced so let's say you want to take a memory snapshot of a certain node but as you're doing that and as you're exceeding the resources you have been assigned your pod gets moved to a different node which loses the purpose so there's a real sensitivity here how you size and scale this type of memory dump using gke infrastructure and how your cluster operates um and some of those examples I've shown you here is what you can face if you're not careful uh the other piece which is interesting is that GK provides through the API something called the node selector so if
you want to deploy a pod you can actually assign that through the API using the node selector to say I want to go and assign this pod to this GK node which provides us with a great opportunity to deploy these custom privileged containers where we want them to be the method I'm using here is all using open source tools so as we talked about avml to do the memory dump dwarf to Json to build a simple file and then volatility three to do the complete analysis of the process using the memory lamp although the scripts and the setup I've done here is my own anybody could go off and do this today using the knowledge in this talk
so all of these tools are available you can Implement them in any way shape or form you feel is applicable to your infrastructure and as far as I know there's yeah as far as I know the this hasn't been done before that's a big statement I talked to some of the people in the volatility 3 community and from what I could tell from them there is no documented way so far to do this type of analysis on gke so again if you have uh you know other tools available that do streaming Telemetry on GK perfect but if you are already using tools like avml for memory dumps on other Linux systems this method is extending those capabilities to gke
to do memory snapshots um we also mentioned the uh the public facing API although not documented where you can acquire the VM Linux file if you know the build ID of the COS that is running on your gke node and again lab in this case I was using Python and terraform there's a endless ways to implement this using your own coding language whatever you feel applicable as long as you combine these three open source tools some future improvements from my side would be looking at resource calculation for your cluster so like knowing how much resources you have on a node before deploying and scaling the privileged container to do the memory dump so there are a couple of ways to do that where
you can see like okay how much storage do I have left how much CPU do I have and then you can size that to your privileged container so that it doesn't over consume those resources um automated deployments there's a couple of ways to do this as well there's apis to deploy pods to certain containers sorry to certain nodes using the node selector up here um and if you combine this with for example disk thumbs or network pcaps that should give some really good puzzle pieces together for what is happening on your GK infrastructure that was all I had if you want to get in touch here's my uh contact information and I also published this code this morning on GitHub so feel
free to go there and download it and try it out yourself I should say it's still in the early stages so I'm going to be making improvements to that so if you find any mistakes on my part let me know and I'll fix that but everything I did in this talk you can do as well using the code in this GitHub repository thank you and I'm happy to take your questions hey we have the question I can't see who pointed first but like let's do you in the front and then one in the back [Music]
right so I'm going to try to repeat the question and let me know if I got it right so the question was if I consider to automate this process and also to automate to shut down the GK node if it turns out we find malicious purpose uh so we're not using this in production for this right now uh I would say there are a couple of great great ways you could do that uh also I would say um you would be very mindful before shutting down notes in in say the production environment but basically the apis for this are available so like you could automate this using a soar platform or something else again I'm
using python code to make it distributed so anybody could use it but basically using the apis you can do the exact same thing and connect both to the forensic instance to run the analysis and then if you find say certain artifacts or certain indicators that you're like oh this is where let's terminate instance and do additional analysis you could automate that as well using the Google API so we haven't done it but it's definitely possible and then we had a question in the back
foreign exactly so I'll try to repeat the question and let me know if I got it so the question was if we will get additional context or if it would be easier to SSH to the instance itself and then run the same thing was that the question yeah okay cool uh that is very true and that's far easier so let's say if you have a service account or something else that allows you SSH connectivity to the GK node that would of course give you access to the host file system right away uh we at Spotify don't allow that in production at all so there's no way you can using SSH to get access to our production nodes which is
why I took this format and I was using this approach right here where you have the pod which is privileged with then removed once you finish but you're totally right you could do the exact same thing if you have SSH access I know this is before lunch any more questions otherwise I'm gonna let you all go one more question
so let's see if I've got a question right so like um this is a very targeted approach as you said right but if I had considered a more enterprise-wide approach or like girls right so I would say if you would like to do this at a broader scale so not for a specific gke node you probably should consider some of the tools that are available at scale for like Telemetry so there are things like you know cystic encapsulate that monitors your container workloads at scale this one is more targeted because well first of all you could run this let's say for more notes in parallel but that is not going to be really feasible so for that type of approach I would say
you should probably consider something which is Enterprise wide in terms of telemetry and then you could still do this as a very focused exercise if you get a certain indicator or something that says oh this specific node is weird but you still have the Telemetry for your entire GK space so sort of answering the question like this okay cool okay I want to say thank you all for listening and I will say I also have a great team from Spotify here today and it's thanks to those great people and my girlfriend as well that I've been able to do this so thank you to them and thank you
Related talks
 49:58
49:58 33:46
33:46 30:07
30:07 22:40
22:40 28:47
28:47 28:59
28:59