Detection & Response at Planet Scale - Travis Lanham
Show transcript [en]
up next detection and response on its scale Travis Sanam is the Uber Tech lead of security operations at Google Cloud overseeing the technical strategy and direction of teams working on exite scale security detection and response he previously worked in Google's Network infrastructure engineering team welcome ch
you need a dongle actually
thank you
great thanks so much uh so today uh I wanted to talk about how we're kind of approaching the security operations program uh and what we what we do uh and how we build towards our goal of you know detecting threats before they can impact our users and our customers uh and so our team works on building the platform that our analysts use to protect those users and customers and so how we've approach this is really thinking of security is a big data problem and saying even if you have you know endpoint controls network controls identity controls that you really need this kind of global layer of visibility over everything and for that you want to
kind of bring your data into one place use analysis over that data to inform controls that happen at the control Point itself uh and then do preventive Mees and so this kind of complements the approach that we take on things like theond for zero trust solution where we say we want to be able to prevent attacks before they happen but when they do we want to be able to detect them quickly and we want to be able to use that to inform our prevention and so for that we start with kind of bringing this planet scale visibility into the threat picture cultivating threat intelligence from many different sources Gathering data from all the different monitoring
sources that we have available to us and then implying that to do detection to do protection at a very large scale to be able to kind of say hey let's take as broad a cut of this data as possible let's surface up all the things that could possibly be issues and then really relentlessly funnel that down or filter that down aggregate it you know cluster it into things that are useful for human analysts to take up and go investigate uh and get us to a point where we can say this is actually something that you know can be a meaningful case can be something that goes and is work for the workload owner to get to a resolution on
and then taking you know all that those detections that analysis we have providing this kind of risk or context lens on top of that to inform the prioritization of those cases uh and then when they're resolved using that as a mechanism of having continuous Improvement in the system right so saying we don't just want to continue to have the same issues come up over and over again we want to use when an issue happens to inform how should the ction posture of the system change how should the monitoring change and then make those adjustments or make corresponding governance and and risk adjustments as well and so for us this kind of starts at this bottom of the stack or taking in
all this visibility and then organizing it and making that useful so with that we start with kind of all these different places that we can collect Network Telemetry from from you know all the hosts that we have additional data sources uh and then the visibility we have particularly on the threat landscape that comes from you know things like Gmail mailboxes uh you know safe browsing which SC all the Chrome URLs uh all the visibility that we have into you know Google drive files and things like that that can be used to protect users uh and more and so all of that thread Andel gets kind of put into a picture uh and then joined against all
the Telemetry that we collect and the Telemetry that we collect comes from many different sources it comes from you prod production environments it comes from Corp environments it comes from all different modalities of endpoint Network identity v data context data we put a particular focus on bringing you know sources into the system that aren't normally brought into SIM systems or security analytics systems so in addition to getting you know really volumous Telemetry sources like firewall logs sessioned Network flow logs we also focus on bringing in context so that we can kind of take all of that data structure it and then use it to build this map of the environment or build this kind of
representation of all the entities in the environment and in order to do that we bring that context data from sources like cmdb you vulnerability standards and then the runtime information inferred from the logs themselves right taking all the DHCP logs and stitching together sessions that allow us to say hey here is the representation of a host name that corresponds to this IP address address that corresponds to this Mac address being able to do that whenever new data comes into the system so if we have lat arriving gcp log or out of order logs or different context data that comes in at different times from different sources we can bring all of that together to stitch together unified
representations of the assets the users and the resources in the system and then that allows us to enrich all those logs with kind of that full spectrum of visability so that we could say we start with a simple firewall log that might have an IP address in it and we can now build out this much richer picture of here's the host here's who owns that post here's kind of the full set of context that you would want to be able to do an effective investigation around this and then with that we start building detection so we say once we have that kind of primary source of data we've taken in all of those logs we've
structured that so that we can enrich it we've done that enrichment we now kind of take that visibility we have in the threat landscape and we join it against all the data that we process and what that gets us is this kind of nice picture of a first level of detection in the system right or this kind of initial you know relatively low Fidelity but really interesting kind of picture of what's going on you know are there you potential Attack Records in the system what might be happening and it gets us to this point of going from trillions of events to kind of billions of these low Fidelity signals that we can have right and so for each kind of set of threat
intelligence that we pull into the system we start with a threat report we'll pull indicators out of that threat report we'll expand those indicators so going from you know just the original IPS domains file hashes into collections uh that we can get from you know sources like virus total where we have hey here's a file hash and here's a set of related hashes to that right or it might even be that it's something that we don't have an explicit relationship against yet but we can infer from different you know metadata attributes about the binaries or additional kind of secondary attributes that we have who is registration things like that so we start with that kind of
Let's scan the data for that first set of primary indicators and then we scan the data for this kind of secondary or expanded set of indicators using things like hey we want to see what things aren't just implicated in the attack know about but here are the things that surround them or have shared attributes that we can provide kind of additional oh this might not be something that folks know about yet but this is something that you folks should be aware of right so we start with that primary indicators secondary indicators and then we overlay behavioral ttps that our threat researchers develop to also scan and surface up things that might not you know be left as kind of evidence of an
attack or you know dug up during forensics but are you know things that are helping us expand this picture kind of capture a broader net of activity that can then be investigated and so from there we're able to kind of take all of this scan this retroactively against the data uh you know for things like the behavioral scanning we do this you know in a batch mode so it might not be instantaneous but we can kind of chew through all the data that we have in the system and get that kind of compiled automated compromise assessment that then can be handed off to an analyst to go and work uh so there we're able to kind of now
take this you know that raw Intel that we have in the system and package that up into something that's a bit you know more fully finished then analyst can go and actually engage with and now we've been able to capture not only those kind of simple indicators but now these kind of more behavioral type detections as well right whether they be from those inferred indicators whether they also be from things that we infer for metrics like hey here's a low prevalence binary talking to a low prevalence domain right so we can now alert on these kind of Behavioral signals or broader signals rather than having know explicit indicators that we have to match against and then for here uh what we say
is okay we take all that thread Intel we index it against our log so that we can provide really fast uh investigative search for analysts uh and that kind of comes in two forms right one form is anytime someone goes and wants to look up an IP address or look up a domain or look up an asset or a user we want that search to be as fast as possible well cach events will go and kind of rank and score events that come through the system so that we'll say hey these logs are actually more interesting because they're you know for prevalence IP addresses right or these logs are more interesting because they're file hashes
that be correlate against red Intel and so we'll provide this index search against the logs with that fast retrieval we'll also provide really kind of powerful analytical queries so that analysts can go and look at metrics in the system so they can see interested in you know posts that have you know interacted with low prevalence domains and you know low prevalence domains that have been registered in countries that you know are on a watch list for us right or on a you know something that we might want to keep closer track of and then this allows us to kind of build up to that you know signature based detection system where we've now said hey we taken this broad swap of
telemetry we do this initial kind of red Intel assessment on that Telemetry and now we have another kind of pass of this where we have threat researchers that are constantly putting in different types of detections these could be trip wire detection where we're looking for things like command line rx's I mutexes things like that they could be whatever kind of signature of AC you researcher might be interested in and then we're able to evaluate these against that enriched event stream in real time and then provide this kind of Base finding or kind of this first pass of here's the interesting data that you might want to take a look at and so when we get to
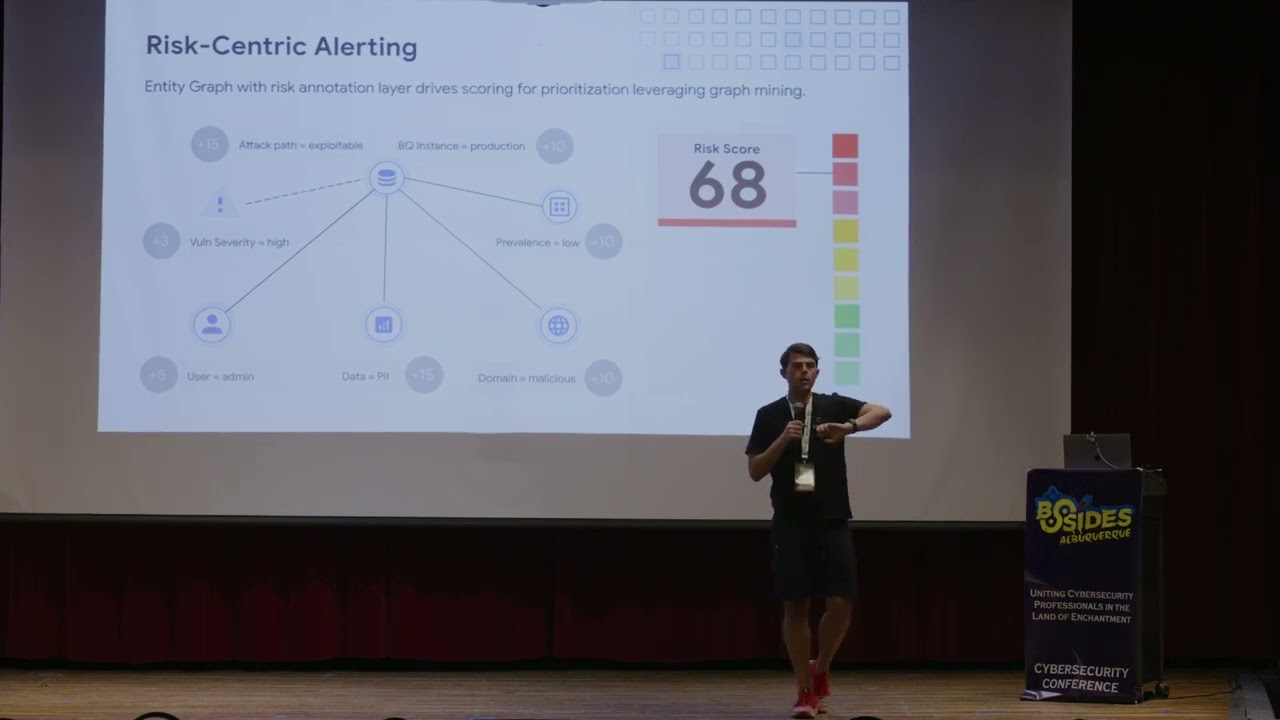
that it's still way too much for a human analyst to go and look at right we've taken in all this data we've gone and correlated with red Intel we've done kind of this first pass of protection against it but it's still something that's nowhere near uh you know scalable for for humans to go like that and so there we kind of have two main techniques that we built out to support doing that analysis on top of this large volume ofs uh one is basically around using metrics and risk is kind of a layer on top of those findings so rather than looking at individual findings going and looking at a risk view of the data so we take all those entities that
we inferred from this lemet Tre or that we ingested explicitly from other sources of Truth we build out this graph of relationships in the Enterprise so that we can say hey here's all the different you know envies here's who's interacting with who here's how often they're interacting with each other here's the kind of contextual linkages between them could come from our permission access management data uh that could come from our IM system data and now we're able to take that threat view or take that you know hey we' brought in all the logs we correlated against red Intel we have those initial detections and now we can correlate against this kind of picture of the
context so we can say hey we might have you know something that looks like thread actor activity it's a be can CNC it's some other TTP that we have and we can say okay is this exploitable you know the machine this was discovered on you know are they running unpatched software is this something that an attacker could actually be exploiting right now obviously that'll depend on the ttb on whether it's an indication that already has been exploited but if it's something that's you know more on the bone side or it's something that's just kind of you know a lower Fidelity indicator this kind of contextual picture allows us to say hey we can filter out a lot of stuff that just
isn't of Interest right whether it be things you know that are from a development environment for the security team you know somewhere where we' expect this kind of activity to be happening and now we can kind of put focus on the pieces that are most important right we've discovered a vulnerability we've seen some runtime and signal that has been exploited and we know that the impact of that exploitation would actually be significant right we can infer from the context that you know an exploitation of this system would lead to a lateral movement opportunity that would lead to you know critical data in a database or you F system that might have you know user pii that might have
sensitive financial information that might have other data that we would consider to be you know high risk right or high you know high impact if it was exploited or if it were Expo creater and so this gets us to taking those kind of billions of detections or kind of millions of alerts that would come out in the system and being able to prioritize them and be able to say hey these are the ones that are most worthy of human attention are most worthy of you know being kind of passed into other parts of the system that would then do you know aggregation if they're not worthy being looked at immediately at that time right so that we could say hey
there might be certain situations where something should just be looked at immediately right this could be something if it's in you know production environment if it would have access to sensitive data if there would be you know sensitive admin privileges that would be available uh for an attacker and if it's something that's you know hey this might be something worth looking at but it can kind of be bch into something with you know additional similar alerts or additional kind of similar findings then that could be grouped together and and Shi off to an analyst as a single face and so that gets us to kind of the the other piece of the this kind of postprocessing
element after detection we built out in the system which is basically looking at how can we take those alerts and find linkage between them and do this in a more automated way than what we previously did which is around we started with being would say hey we can just kind of provide you know simple grouping capabilities to analysts we can say we're interested in things that happen on the same post or we're interested in things that happened to the same user or we're interested in things that happened with the same artifact you know the domain and IP address Etc right and how can we provide you know a less fistic driven linkage between the alerts and so for this we
built out a bunch of AI models that allow us to say hey we can extract featur from those alerts things like when they happen the EnV that were impacted the you know ttps that might be associated with the detection that generated the alert we can pull all of those together and now create you these kind of clusters or or Paths of the attack activity in the system or you know things that are related from an a learning standpoint and what this gets us is a much kind of compressed view of everything that we had at that previous detection stage so now these can be grouped together and shipped over to an analyst where they can say okay we now
have this kind of broader picture of what was going on around this time we don't need to be you know having humans piece together these alerts manually and we can use the prioritization or kind of Contex signals to drive that additional ranking or prioritization about this and so what this gets us to that we've seen you know when we've applied this to Endo words for example is being able to kind of reduce the noise down by by a signicant factor and this also allows us to apply additional characteristics on top of the groupings where we can say things like okay if there were you know if there was a routine maintenance patch that came through and it triggered some
trip wire detections it's now easier for us to say okay we've now have those kind of group together even though before we might not necessarily have had a grouping rule that was looking at things like oh what's the software maintenance window you know what's the application that's being deployed that's triggering you know all these alerts now this is done in a more General way and now additional characteristics can be added on top of that to say hey if we see you know this kind of you know all the software on these hosts has changed recently now we should just you know mute this right or maybe this kind of goes into a lower priority Cube where it
can be looked at separately and so here what we done is said okay we took in that full stream of the logs that full stream of the Telemetry we've overlaid that kind of thread and tell picture on top of it we've gone and done that first layer of detection whether be turistic based detection trip wires things like that whether that be more behavioral detection with all the metrics that we've generated in the system so that we can say hey here's you know this is the first time this host is interacting with this doing this is the first time that this you know collection of of files or executables that are related to each other has been seen in the system and
they're contacting a bunch of ips that haven't been seen before and now we're kind of building this into this you know picture of okay we have those detections we now have this kind of prioritization and this grouping or clustering that we're able to compress those signals down we're able to provide this kind of ranking input on top of them and we're able to package this up now as something that's much easier to scale out to a team of human analysts and now those analysts are now you know kind of also empowered with this contextual view right or this hey we now know that you know we're looking at this alert and if this was you know exploited here's kind
of the impact from a business standpoint so we're laying on top of you know that those detections this business risk kind of view uh of what's going on and that allows us to kind of build up to the the kind of final Point around continuous Improvement in the system based on the response activity that we take right so we say you know based on when we actually get that case off to a human they'll go and do you know a variety of things that you would do response right it could be contacting workload owner it could be doing additional investigation it could be doing a forensic analysis you know executable that's involved it could be this kind of wide variety of
things that might happen uh but then no matter what the result of that analysis is we want to learn from it we want to improve the system and you know get it to a state where now that we have that learning we can either improve the Fidelity of detection monitoring we can improve the posture kind of governance that we have and make sure that that doesn't happen again and then ensure that there aren't regressions against that and so here there's kind of two pieces that we focused on one is more recent which is around how can we you know enable assisted response or how can we enable our analyst to be more efficient and then the other is how can
we you know have kind of more of a compliance lens or more of a risk governance lens uh and use those kind of findings from continuous Improvement to reduce no system in the future and so on the assisted response side this is a more recent project that we work on we've said how can we go and take uh you know large language models uh like L's Gemini model and use that to enable a security analyst to do a faster investigation in particular we focused on kind of the initial triage phase of workflow where we said how can we connect in all of the data sources that analyst would typically pull up when they're looking to triage right this
could be from thread Intel these could be sources you know about asset information these could be sources about you know external artifact either activity or context bring all those all those kind of data points together and then enable an analyst to ask natural language questions uh enable an analyst to get this kind of easier picture kind of this you more complete picture presented to them and most importantly this kind of ties into enabling them to see what's historically happened right so enabling them to hey here's how similar alerts have been resolved in the past right because one piece is kind of showing them a bunch of information and showing them a bunch of context but particularly for new
analysts on the team the biggest Improvement is showing them what a senior analyst has done with the alert in the past right and kind of helping bring this institutional knowledge in the soft or this institutional knowledge in the security team to a new analyst to scale them up and you know accelerate their ramp into understanding okay here's you know here's kind of what this environment looks like right or here's how it looks like this should be handled and so to do this we take those data sources we take that Foundation model we find tunic with the security data and now we provide that to an analyst to be able to do this you know assisted
response right where now when they're looking at that alert they have this you know historical picture of what's happened in the past they can kind of get contextual information easily and it's presented to them in a way where they can you know quickly understand what's going on the system they don't need to have a lot of context on which particular place they need to go and pull the data uh you although you know they can always click in then over time they'll they'll kind of learn those systems in the same way that more senior analyst would and then you know in the future we plan on kind of bringing this to other parts of that workflow right so
kind of starting with triage because it's one of these simpler Parts where it's mainly about bringing a bunch of information together and synthesizing it and then the next piece being you know things like scoping the investigation right uh this comes in with things like you know here are the similar alerts or here are kind of the similar signals that you might be interested in when you're looking at this but it also includes things on okay we have an alert on this asset here's the other activity that was happening on this asset at this time and based on that other activity we might be interested now in you know okay we were looking at this asset it
contacted this domain we can now kind of take another step from that domain onto other similar domains and now we can you know provide this kind of uh this kind of scoping activity where we can now say okay there might be a connection you know between that domain and other alerts that are being you know worked on at this time right and so we can pull together all of those different pieces so that we can say hey here's kind of the full scope of the investigation and you one analyst might be working on one part of this another analyst might be working on another part and how can those you know different work streams be
mer together how can we provide this kind of Contex over the so where enable analysts to understand what other folks are working on and bring that all into kind of one picture for everyone to understand and then increasingly uh you know even further beyond that how can we think of this as something that we go from you know assistance into more automation right particularly around things like triage where now once we have a lot of feedback from analysts uh we can now kind of encode that as at triage that you know it first could be something like here's a suggestion on whether this alert should be dismissed or not and then in the future kind of
doing more Auto disposition on the and that kind of gets us into the three kind of pillars we have around continuous Improvement or once we have that response activity encoded in the system what do we do with it right so if it's something like hey we've closed this you know alert as a false positive we want to ensure that the anal power to either go and update the monitoring that generate that detection or is able to pass it on to the detection engineering team as feedback to say Hey you know there were false positives around this this needs to be adjusted in this way or this wasn't applicable for this particular environment and here's how we
can go and tune those signals so we can get much richer monitoring in the future and we can kind of keep this nice you know yield uh where we look at a metric around you know what's the the true positive rate that we're getting out of the detections and the wasted work from false positives that we're consuming from analysts so that we can have a high analyst productivity not only in you know an analyst being able to look at you know a certain number of alerts or look at a certain number of difficult alerts but being able to have that work be put to good use right to be able to have that work be put to you know
productive investigations and not be put uh into into things that you don't bear fruit or kind of just false positive based on oh you know this is that someone on security team set up and so of course we'd expect there to be you know some funny Behavior going on but it's not something that's actually a problem and so that's that kind of first piece on how do we improve the monitoring the second piece is around how do we turn things that you know might be true positives uh or things that we want to look at into better prevention or into better governance right and so that gets us to okay if we see that you know there was an account
that didn't have two Factor authentication in enbl on it right how do I I identify that hey here's this kind of cohort of users where there needs to be you know kind of governance or compliance you know poke or a you know you know these folks need to go and have you know someone follow up with them someone go and you know ensure that this particular team you know follows the same kind of uh you know set of requirements Etc right and then kind of get to this okay if we had an alert and it wasn't important we update the monitor we had an alert and it was something of Interest now we need to go
and put preventive controls in place we need to go and look at okay here's how we can you know roll out you know compliance uh you know a compliance you know nudge to to this part of the organization to go and you know adjust their behavior adjust their systems so that this doesn't happen in the future and then the kind of final pillar in that is being able to say okay now that we have those controls in place right or now that we have okay we're monitoring what the two Factor authentication compliance is with this part of the organization how do we ensure that we don't have slippage against that right or how do we have this kind of
regression prevention and so there we look at things like how do we actually go and test our detections regularly so that we trigger the behavior that we want to be monitoring against how do we go and Trigger the behavior that we would want to have you know a governance monitoring or governance control tracking and so for that we have you know automated systems that go and you know have agents that represent or kind of look you know look like a certain part of the system this could be you know something that's supposed to act like an endpoint and occasionally you know detonate something that looks like it's malware to see if it actually gets stopped by an endpoint control this
could be you know something that's an agent that's going in testing a network boundary to ensure that a firewall is correctly configured in place the same for identity Etc and so that kind of brings us onto the okay now we've you know brought in all this data we've kind of looked at this broader you know threat landscape uh We've you know put in all the detections that our researchers are interested in we've gone in a loud triage over that uh and we've gone and prioritize the things that that come out over that we've gone and clustered them together so that they're more consumable for humans to work as cases once those cases get to the humans
we try to enable them to be more efficient in how they handle them once you know they kind of do that disposition on the case then we enable the system to improve by either improving the monitoring or improving the governance and compliance around it uh and then monitoring against regressions against that and that's it thank you so much any [Applause] questions okay we have for one question
hi it looked early on that most of the the data that see system is well formatted and then when you were on the SE LM um slide you mentioned that senior analyst historical responses to things would also be part of um information to like a junior analyst is that well formatted data or is that coming from a language model or how do you that into your system yes great great question so there's kind of two parts to that one part is basically the Telemetry itself and so some of that's very well structured some of that's you know not as well structured and so there's a lot of techniques that we have on ensuring that we get quality structured data out
of it no matter of the source then you know all the detections happen Etc and then the you know what is provided that triage phas can be from two sources it can be from you know kind of metric sources on hey for these types of alerts here was the status in the past your was the criticality status in the past or it can be you more preform semi-structured comments or you know analyst feedback you know things that might be you know like you know you know go reach out to a workload owner they respond with a response of oh this doesn't matter for this environment that it's not captured in a structured way and so that's kind
of where the language model has helped being able to say okay now we can provide kind of a more in-depth analysis on some of those less structured pieces we can just take one more
in great thank you so much Trav
Related talks
 28:10
28:10 22:31
22:31 17:57
17:57 28:08
28:08 47:24
47:24 23:12
23:12