BinDbg: Easy Windows Debugging for Binary Ninja

Show original YouTube description
Show transcript [en]
cool give another minute to cool so I get started I'm Dave this is a talk about a reverse engineering tool that I made if your eyes have already started to glaze over you can leave I won't be mad rooms not empty good sign so a little bit about myself my name is Dave Cook fuh by day I am a corporate security engineer in a big company I know I'll get the token disclaimer out of the way right now everything in this talk is released on my own behalf I'm here like representing myself not my employer so by day I do corporate security and by night I am a reverse engineer I've been working on a game
hacking project for about two years now I've got nothing better to do with my time it's fine I'm graduated from the CSEC program last year and I currently live in the San Francisco Bay Area I have a blog at cook for that CEO and I'm also on twitter at cook pho underscore so let's talk binary analysis how many people have heard of item before or have used it few hands all right how many people have paid for like the full version of item before no hands awesome that is my problem Ida Pro is very very expensive a full fledge license with all the bells and whistles will typically run like multiple thousands of dollars which for
hobbyists and people who do this kind of stuff for fun is very very hard to justify like to your significant other or to yourself even when you're spending the amount of money you get like a used car for on a piece of software typically like very hard to justify on the other hand of that there are professional reverse engineers and people who do this for a living or people who are like extreme reversing enthusiasts who like for them when this is maybe like 5% of the profit that they're making or whatever like they're making a lot of money from reversing then it's more justifiable or if you have a corporate like a big company that's gonna shell
out you know five grand I'd like the drop of a hat then yeah this really isn't like that big of an expense but for hobbyists it's it's a big deal to spend that kind of money on tools to pursue your hobby so that's sort of been the problem for the past couple years Ida is very expensive but it's like the best in class it's really really good at what it does and it is like the gold standard reverse engineering as of recently there have been several other products that have begun to challenge that so we have tools like radar we have tools like hopper and in my case binary ninja where they're these open-source are very very
cheap comparatively like a hundred dollar license versus like a five grand license for reverse engineering tools and for me I've been supporting binary ninja I think since it came out of the beta and I've been following along but I've always had to resort back to Ida until binary n and just started adding better Windows support so they have like a PD B loader now so it works better with debugging symbols there's just a lot of gradual improvements and it's really really become like a very powerful tool now in the grand scheme of reverse engineering tools in my case so binary ninja is in apparently a static analysis tool and in my case trying to convert from Ida over
to binary ninja the one thing that I missed was the ability to switch between static analysis like looking at your disassembler and just jumping it like the job of a head into a debugger and being able to have dynamic analysis so you can see like the state of your registers you can see like the state of memory you know the table calls all that stuff like all that dynamic goodness is wrapped into the product where with binary ninja you'd have to run a separate program for that you have to run your debugger which gets very tiring and there's a lot of manual like back and forth and I wanted to just integrate the two solutions together and just fuse
them onto one product sort of like Ida did so I set out to create that with a binary ninja plugin and I came up with bin-debug which is a combination of binary ninja and wind a bug feed debugger so basically the plug-in will take window bug and use a PI pi KD it's called it like a Python wrapper around the window bug API in order to combine the two and you get both your stack analysis through binary ninja and your dynamic analysis through your debugger so we sort of supplement like the static information that binge is really good at with the dynamic information live debugger and there's also a bunch of controls and gooey stuff built into binary ninja they
just have this one like UI one product again sort of like Ida does so this inherently is not really like a novel idea this has been done before the two prime examples here are tool called binge a Tron buy snare which is basically a same thing except with the different debugging platform called Voltron which is a wrapper around a number of other debuggers window bug included and there's a more in the UI side there's a project by an NCC group intern named Erik an infant who made this tool called bench of dynamics which is basically a really cool GUI thing but again like a solves the dynamic analysis problem with Benja but then also has
like a nice nice fancy UI it's more oriented towards people who are new to reverse engineering and just gives more of GUI like easy-to-use feel rather than your ancient like window bug command-line stuff the problem being is that with both these solutions the windows support is either not there or is lacking like in my case there are a lot of Hoops to jump through to get up and running on Windows and I wanted to create something that was just easier to use right out of the box and just like show windows some of pretty much so for me in my case when I was reverse-engineering video games that's really like a Windows thing I'm reverse engineering Pease more than any
other type of binary so I wanted to create something that was good for Windows so for the the plug-in itself most of the primary features are just things that integrate with in binary ninjas GUI so like for example we can launch and control the debugger directly from Benja so we get these buttons on top with that have your typical debugger controls like start/stop set a breakpoint you know step over step in step out and then we can also sync the debugger information like the instruction pointer directly to the binary ninja disassembly graph so for anyone who's familiar with Ida or with binary ninja you get like a nice graph of all the basic blocks of the program
and like all the different functions and everything they're all very like graphed out you know it's pretty graph of where your your control flow of your program goes but with your disassemble or your debugger with window bug you just get like a plain text output of a bunch of instructions it's kind of hard to see where the program flow is going to go so I want to combine that into bin just so that you can have a nice pretty graph and then also get the dynamic view from your debugger again like you can set breakpoints and you can move your instruction pointer directly using the disassembly graph so like you can just right-click on an instruction and set a
breakpoint there you can run the program up to that certain instruction or you can just have the instruction reporter jump all the way down to that point and not ask you all the codes that's like a classic technique for getting around like software protections like your no answer key code you just jump over the function where it asks for the serial and runs the rest of the program is normal crushing over there I think it does all the threads currently um that's an interesting question I don't know if there's actually support for that at the window bug level even but yeah at least in for for my case yeah it's just all threads so another solution or another
feature here is the the branch decision highlighting so if you were to reach like a jump instruction when you're looking at just the stack analysis you don't have the alive like the register view you're not able to see what's going on there just be this jump here and you wouldn't know whether you would take the jump or whether you'd continue executing down so what we're able to do with with bin-debug just take the register views send that over to binary ninja and then like graphically highlight like we're not going to take this jump instruction we're going to highlight green where our program is going to go so we're going to go into this first basic block here
instead of taking the jump to the second and it highlights that in terms of like where the instruction board is gonna go so I got a nice little demo here also recorded on case fall in my face here but so we have binary ninja up this is the scroll down so this is like the graph of our program these are like a different basic blocks that'll be executed if we wanted to start our debugging for this example program you can right-click on an initialize toolbar so that's the little control toolbar that I was talking about earlier you can set the process arguments if you have any special argument to want to pass to the program when it runs so like for
example for this for this game you need to do ran from launcher in order for the game to execute and then you can just take go up here and it'll spin open the debugger and will start executing the program so right now it's loading all the break that we saved from the last session which takes a little bit we can open our memory view and a view of the registers here so we keep those open to the side I tried integrating this into binary ninja itself but it was a lot easier just to let window bug do it because basically you have to send a whole bunch of memory over its binary ninja and it
was just a big hassle so it's just easier to sort of keep it out to the side but keep that information separate from Benja itself but once this is loaded we can go over to our example function over here bring this up and we can set a breakpoint over here cool so the breakpoints set and if we go over to our debugger we can see these these commands that are being back and forth sent back and forth so so far we have synced the debugger information to binary ninja and we set a breakpoint at the certain address which correlates to this function over here and now we can just execute the program and it's going
to run until we hit this this first place where I set the breakpoint up here so the yellow over here is our current instruction pointer and we can just go and step through our program is normal here so one of the cool things that I built into sort of automate a lot of the manual analysis with reverse engineering is as anyone familiar with the tables before I worked with the tables in reversing basically it is it's basically a way that C++ handles polymorphism and from the static analysis standpoint it's really troubling because like you'd see like for example here you just see like register values and then down at the bottom here it goes call EDX and you
don't know what EDX is you don't know what function is being called until you're actually executing that program in your you can actually tell what it's going to do and my way of solving this previously was you just have to run the program in a debugger go back over to your disassembler and then comment like when I ran this this was the function that was actually being called so what I wanted to do with the debugger here was to actually have it like automatically annotate which functions were being called which which functions are being records from the beat tables so like as I execute through this this function here it's going to go through and
annotate like call EDX like this is what was actually called was this game client States program here our function here so again like just automatically executing through stepping through each of the instructions here we get like a much better idea of what's actually going on in the program when we go and look at it again from a static analysis standpoint so we can just like save our analysis file here and in binary ninja and open it back up and see which functions were executed so we can continue stepping through here and we get to our first branch instruction and we see that we're going to execute here we're not going to take this jump so we keep going and it
keeps annotating and we're gonna call another vtable function so let's say we want to just get out of this function entirely we can just do run the cursor down here and say we want to execute up to this point and then our debugger is just going to go execute all the instructions that hits this push instruction and then we can step the rest of the way out of the function and our games gonna spin up so just like a quick brief little demo again like this is more of like a hacky script at this point there's really not much to it but it's kind of like it just something simple that made my life a hell of a lot
easier and really took a lot of that static analysis time that goes in the reverse engineering and just automated a lot of it so a couple lessons learned I spent a lot of time trying to deal with pairs in pi KD which is one of the underlying technologies that I used in order to implement the debugger API and Python like a lot of the time that I spent trying to solve these errors was just in the end fixed by just like catching them and just ignoring them which is kind of like a really bad software design decision but like I found that pi K T is very very finicky and like it doesn't really like the errors that the throws
are just arbitrary for no real reason and they're not very descriptive so like the best way to handle that it was just to catch it and ignore it and everything keeps running as planned which again like I don't really wasn't really too sure but that was like the best solution that I found determining the type of an object in memory using the v-- tables is not a hundred percent reliable in the cases of like multiple inheritance when you have like a class that would inherit from two other classes basically the feed table layout in memory would just have the V table of one of those two classes and at the top of the object so
basically the way that I used to determine the object type was not a hundred percent reliable and I was really confused when I hit a case of multiple inheritance like why things were matching up basically it's a it's an inexact science in the end like trying to do all this stuff on Windows when I previously worked in like Linux and UNIX environment was very very strange just because Windows has its own very weird way of doing things specifically in terms of like the named pipes and which is how I use to communicate between binary ninja and window bug and just the the general like windows api and the communist and stuff like that it's very strange having come
from like a linux background and like in hindsight i spent all this time making this tool when like looking back I don't know I thought this would just be like a quick weekend project and like six months later I'm finally like releasing the tool it would have been easier just to like improve Windows support on existing solutions rather than try and do everything my way sorry Elvis but yeah I would have saved a lot of time prior to just I've tried to improve existing solutions instead of making my own I think but now that I made this thing and I kind of like it I'm just going to keep going down the road yeah so the all the code is up on github
at this point I just released the - hola love like 24 hours ago so it's probably very bug-ridden and very I mean it's extremely a key so like please go and find issues in this and let me know so I can pick some blood on yeah that's all I have for you guys any questions yeah John then I'm not sure if I think you're talking about the demo version I think I think you can I know the licenses are still very cheap compared to like a like an idle license its I think there's like a $99 intro license like a student license or like a hobbyist license and I know there's tons of giveaways all the
time at like conferences and stuff but yeah for the for the free version I'm not sure about that any other questions yeah um you could so the pie Cady step is basically a wrapper on the C++ debugger engine that comes with like the Windows SDK so it's basically just like an easier way to call those functions like if I wanted to I could have made everything in like C++ which would have been like a little bit harder it just would have been like more development effort basically so like yeah we could just call like the windows API directly and just like interface with it that way but it's kind of easier just to have like the Python wrap around
at least I thought it would be easier until it started freaking out on me every every command that tried to run yeah like there's there are other solutions there but they're they're more difficult to use cool yeah I don't have any demos prepared uh-huh oh cool yeah throw something together huh now like I guess like the I can I can point to some good resources there's a book by Nick Cano who talks about a lot of like a whole bunch of very like applicable game hacking like techniques trends like all the background information that I skipped over what I was talking about all this stuff I would totally recommend that book there's lots of like live overflow is a really good
like livestreamer that goes over a bunch of this stuff yeah I don't really have anything on hand that I can show but on this is like this tool is made for game acting so there's definitely like it's applicable to that but I don't have anything that I can give off hand cool leg ties [Applause]
Related talks
 51:16
51:16 33:42
33:42 6:06:45
 47:33
47:33 1:20:35
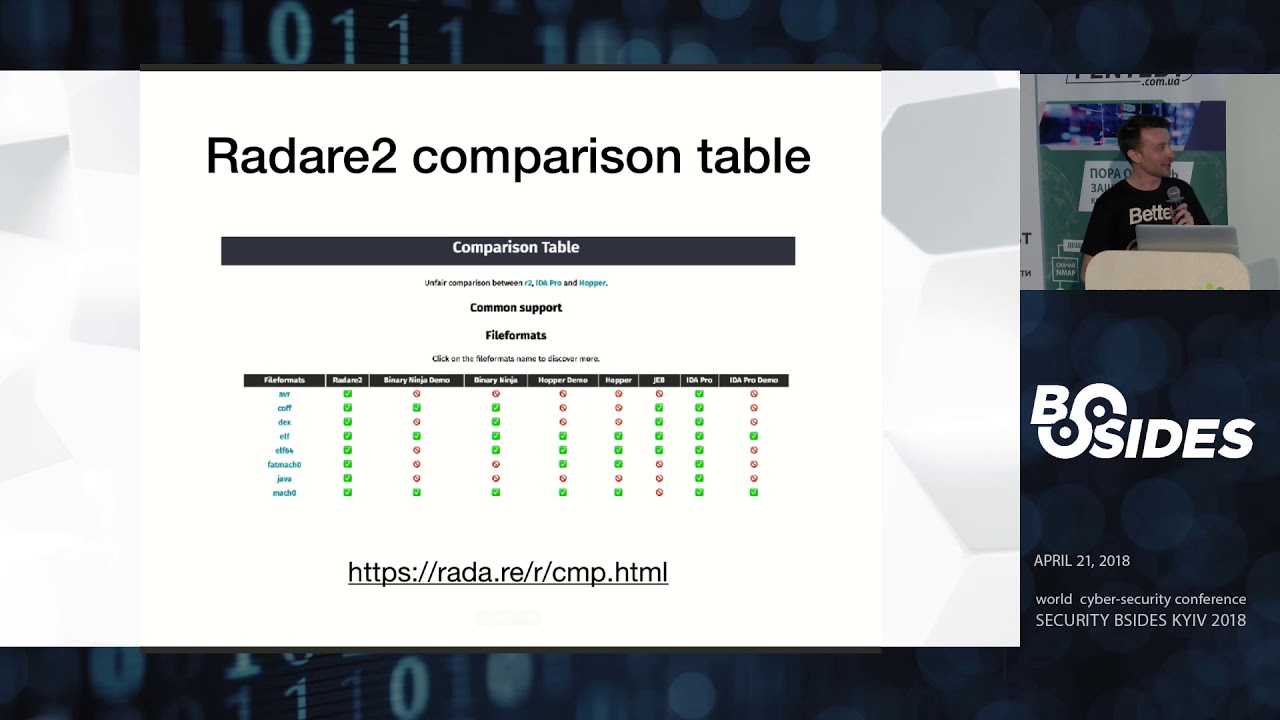 29:55
29:55