To Normalized Logs, and Beyond - Building a Threat Detection Platform from Scratch

Show transcript [en]
hello everyone welcome to normalized logs and Beyond with our speakers Brian Maloney and Dave Levitsky or David Levitsky
hey everyone good afternoon um thanks for sticking with us for one of the last talks of the day my name is Brian Maloney and this is David Levitsky and we work together to build a cloud native threat detection Pipeline and platform for benchling now what is benchling you might ask benchlings the software service platform that powers some of the world's most cutting-edge biotechnology research with customers ranging from two scientists and a molecule startups to some of the largest biotech companies around these will say benchling protects some extremely sensitive data on behalf of their customers and needed a scalable and reliable solution for detecting threats to that data while retaining maximum flexibility for an unknown future our work resulted in a platform
built on replaceable components using combination of AWS Technologies and off-the-shelf Hardware software which is the subject of this talk and just one last note about mentioning we are hiring so if you're interested maybe we can come talk to me um but first let's just briefly go over the steps of threat detection for those of you who might be primarily offensive practitioners or if you're just new to the field this you can think of this kind of as just a brief blue team 101. so this is kind of the the overview of the steps um from collection to normalization enrichment detections running on that security alerts going into investigations and then response actions so what about collection right we start
on the left with collection we we need the data to do our work um collection I think of it is like the hard part um any modern organization of any significant size is going to have a ridiculous number of security data sources from your Enterprise identity and your HR applications things that you use to run your business to your productivity software that you use to to drive to communicate with your customers to the product itself we're a software as a service company so obviously our software generates a ton of data um and these sources they're they're not uniform you know they're they're going to come in in many formats raw text logs delimited formats CSV and space to
limited Json could be some binary formats even um and those come in Via different protocols uh you know some of you may not have to deal with syslog today but a lot of people still do um buckets are a common way of delivering logs as well um and you need a way to get that data into your platform easily HTTP apis via either pull or push are another common method and then Cloud event buses are kind of an up and comer in this space so then once you've got that data into your system you want to normalize it um why do you normalize because you need to be able to do efficient queries on that data
but in order to do that you're going to have to pick some kind of a schema you're going to want to make sure that you have the essential pieces of data that you need and you're going to need to um track those things like time stamps and log sources and then of course you're going to have to think about what goes into your normalization as well um so for example if you do have those raw text logs that may involve regex's regular Expressions which there's some operational risks there which we'll cover maybe in depth a little later CSV logs also if it's a perfectly standardized CSV you're probably not going to run in any trouble but
sometimes you have quotes in the wrong places that then break your parsing so normalizations engines just need to be limited so that they don't run over and they need to be able to handle erroneous data once you have that normalized data you're going to want to enrich that enriching it provides the insights that you need to detect threats to your uh your platforms this enrichment could data could come from internal sources like your Enterprise Data Systems um you know HR systems things like that who's doing what how do we attribute things it could be metadata about your production resources and it could also be indicators of compromise for your detective controls so you may have specific indicators of
compromise that are specific to your platform this may also come from external sources so those indicators of compromise could come from public databases they're like things on GitHub that you can grab or there are vendors that can also provide these kinds of uh threat data that you can use uh with your normalized logs finally once you have been enriched data enrich normalized data you can run detections on those to find the actual Bad actors in your systems this may be predefined indicators of compromise it could be anomaly detection using statistical methods or unsupervised ml models or maybe you know everybody's favorite topic large language models might be part of this in the future but it's important uh to do to be able
to run iterative development of those detections because they do change over time and you want to be able to tune the performance as things change in your environment and you also want to be able to reduce false positives because there's a human cost to this in the next step finally those alerts go to the response team they need the details about what happened and how they can investigate it so you do need to have some kind of a system for alert delivery moving on to the last step and then we'll get into the architecture you want to be able to investigate what happened so you're going to need the same data for that right um One One log Source might indicate
something's wrong and then you need additional context from other sources from there that step you can move to confirming whether it's a malicious actor or benign most the time it's going to be benign but you still have to check every time you get one of these events fire in the case that it is malicious again just wrapping up kind of our blue team 101 you're going to want to contain that intrusion close the vulnerabilities that may have allowed somebody to get in in the first place um prepare and execute your recovery plan and then as always whenever there's some kind of an incident be it an operational incident or security incident you're going to want to conduct
a Lessons Learned section session afterwards so this is what we want to do now how did we actually do it so we're going to jump in now to the architecture so I'm going to go over kind of two parts of the architecture the inputs and then the detection side and then I'll show you just a slide briefly where we put the two together so you can see on the left hand side of the screen we support multiple different sources types those could be HTTP API syslog buckets Etc and those go into a series of lambdas so we are an AWS shop so this will be an AWS specific architecture but this could be applicable to many other clouds
so those we use lambdas for inputs except in the case of syslog which obviously it's not really easy to tie syslog to a Lambda um so for that you'd want to have a traditional more traditional kind of compute platform with a load balancer from those Lambda inputs we then add the origin metadata and run it through Kinesis fire hose which allows us to aggregate huge amounts of data into a semi-structured data bucket and that's kind of our golden storage bucket where we do all of our work from once we get the data in you can see that the same bucket is kind of down on the bottom left of this diagram we can use both aws's analytics tools
and third-party analytics tools with which we connect to the same bucket and this allows us to use the right tool for the job which is one of the most important things that we try to accomplish with this architecture so putting these two sides together this is what the entire thing looks like and it's a little you know it's a little big it's a little complex but it's all managed by infrastructure as code doesn't require very much uh you know care and feeding at all so now we'll get into kind of deep Dives on the different parts of this architecture so to begin with we're going to start with the data collection which is one on
the left hand side of that diagram that we were just looking at so this takes the raw data and brings it into our platform now as we covered previously in the overview the data sources are extremely diverse we have a preference for pull and the reason you want to prefer pull for data collection is because there aren't as many reliability concerns with the pull data source so a pull data source caching is inherent you grab the data when you're ready to receive it and generally that's very very straightforward and allows data buffer On the Origin side with a push data source like syslog or an HTTP receiver that increases the reliability requirements on that input
and the reason for that is that if your input goes down for you know hours days uh then that data will be buffered on the source maybe uh and it will eventually be lost it may be lost right away so that's why we have a strong preference for pull inputs even though we support both in our architecture now the scale can be very large so we needed an architecture that is you know elastically scalable Cloud native and we want that scaling to grow and to shrink as the input changes over time so we want it to handle bursts you know the the old slash dot effect right uh and also just general seasonality of data
where you know nobody uses the platform on a weekend so we don't really you know need to be running a full capacity cluster at that time another goal is to have the cost growth be no more than linear with volume so ideally we can get some economies of scale as the volume goes up the costs may not grow as quickly as the volume does but at the very least you don't want to be paying any more as you get more and more data because that limits your long-term scalability we wanted a system that was limited required limited coding so a lot of these inputs we wanted collaborators to be able to help with this um you know anybody should be able to
get data to us so we developed a system with a significant wrapper functions that allowed you to write many types of inputs in just a few lines of python and we wanted to be resilient to failure and have health monitoring which will cover the specifics of in a few in a few slides most importantly stay Cloud native otherwise you're going to be just paying extra and you're not going to be efficient on the cloud that you're running on so for pull sources the architecture for both sources is kind of similar for all pull sources one way or another in our architecture the notification notification of data will arrive on an eventbridge bus and that will route to an sqsq which is in front
of an input Lambda the reason we use sqsqs instead of going directly from eventbridge to Lambda is because sqsqs allow your Landers to run synchronously and give you some um retry benefits it's more able to redrive data if uh if things don't go so well in your Lambda which can sometimes happen so after the it arrives in that sqsq the function is triggered and the data is collected and written to that Central Kinesis fire hose uh which then goes into our bucket now what about when it's an API that we're pulling from and it's not an S3 bucket S3 buckets are pretty much the trivial case but when it's an API you may not get a web hook notification I
haven't really even seen that eventbridge has a scheduler built in which is an AWS service but that scheduler does have some limitations it doesn't have any ability to catch up if it gets behind it'll just keep monotonically generating cron type events uh and um it doesn't have a sub minute granularity if you need that so we do have a tiny event generator for our poll sources and that runs in fargate and it just generates events into our eventbridge bus that triggers those inputs so this is kind of the visual of what that looks like so as you can see on the left hand side we have log buckets which generate bucket notifications into the event Bridge bus and we have our job
generator which stores booksmarks and dynamodb but otherwise also generates into the same eventbridge bus those trigger those sqs cues which trigger the lambdas in turn Which pull data from either those buckets or public log apis and the logs of course are written to the event the Kinesis fire hose and then onto our bucket now what about those push sources um as I said uh there's syslog still exists in the world uh you might need an HTTP receiver AWS is pretty much completely optimized for building high volume https services so similarly we want to use a similar type of architecture Lambda is a very good tool for this because it doesn't need to process things for long
typically so you can very simply meet this need by building a receiver Lambda behind an API Gateway now you'll need to make your own decisions if you're going to build something like this about how resilient you want it to be do you want to be in you know just multiple era availability zones within one region do you want to be in multiple regions uh and resilient across that but in general again you know you can reuse the code from the pull inputs and use the same formatting and filtering that you would use in your push inputs designed for uh for high volume of course so you do want to allow for batched uploads um if you do an HTTP request for every
single log message you'll quickly overwhelm even aws's scalability and finally since this is a security talk you do need to threat model an https input and decide what the risks are that you're willing to accept um you know in some cases I don't think that it's particularly risky to have this on the internet as long as it's you know right only right only being the important thing um but you know your mileage may vary um be sure to you know threat model this for your own organization now once you have that reliable log endpoint um you can then use collectors to collect things that don't speak HTTP so you know there are many tools for this
um they're open source tools they're easily easy to get easy to install and from there you can make a centralized syslog collector and have that forwarded to http or you can pick up files from machines or you can collect metrics and that all goes into the same pipeline as everything else so once again we're all centralized everything you know is is hunky-dory so far so what if something goes wrong right so obviously these things do uh you do sometimes get malformed logs you do sometimes get uh you know a format changing how do you detect that so again once again we're using an AWS native architecture so we use cloud watch alerts to detect messages and dead letter cues from our
sqs cues too many messages too few messages Lambda failures and the runtime of lambdas because there is a hard limit of lambdas you can set a limit on each Lambda but the longest you can set is 15 minutes so as you start to approach that you do need to tune um typically we only see failures in response to somebody making a change again you can see format changes Downstream but again that's usually due to a human likewise other failures with like run time exceeded or things like that are usually due to some human as well so we have not seen a lot of uh We've not needed a lot of care and feeding and it's usually untraceable to
something in our gitups process so now we've collected the data and we've put it all in a centralized S3 bucket um or actually as part of putting it into an S3 bucket we're going to take this normalization step we developed a companion system uh notice this is the normalization and enrichment step we developed a companion system for managing enrichment data which David will cover a little later on but right now we'll just talk briefly about normalization so we talked about normalization earlier just the why again structured logs are more performant and easier to analyze and you also have an opportunity when you normalize to standardize your field names so there are some common things like username and IP address
that can make your analysis code much easier to write if you use a standardized format we also have some instrumentation inside our normalization engine which allows us to verify if something starts performing poorly if we get less data than we expect it's just another point of instrumentation in addition to our Cloud watch one important choice when you do build your own normalization is whether you want to keep the raw message or not so the whole point of normalization is to reorganize the message into something that's easy to use do you keep the original for us the costs are low enough that we have chosen to keep the raw message that allows us to reprocess in
the future if our schema does change now I mentioned log schemas if you're building from scratch like we did you have an important uh you know very important choice to make in what schema you use there are some very high capability schemas that have a whole lot of uh you know data types in them um they require a more advanced normalizer and a more advanced normalizer requires more care and feeding the more regular Expressions you use the more likely that something could go wrong um but some popular choices as far as those more advanced schemas would be the elastic common schema or the open cyber security schema framework both of those have support by you know fairly large
chunks of the industry but what did we do so we decided to go with a very lightweight wrapper schema as I said that we are retaining the original message so we have a fairly large uh a fairly good ability to take actions further Downstream on that uh that original message or slightly restructured message so we just have a simple wrapper that includes where it came from um what the metadata about how it got there was when we saw it first a deduplication ID and you know the message itself and a few other uh less important fields now again since this is an architecture deep dive we're just going to briefly talk about how we actually accomplish that
normalization and that's what I consider like to be a Cooperative design the inputs give the basic format uh they ensure they verify that the format matches what's expected and structure it so that it's already in you know in a structured data format so it can be embedded into Json without needing to then pull out the data later on um from there it goes to fire hose and fire hose has the ability to run arbitrary functions on uh the messages that go by in firehose so there's an additional normalization Lambda there where we can do centralized processing for example we can add enrichment data into the message if there's something that's going to be transient that we
might need in the future and we can also do um some metrics on the data as it goes by in the normalizer so that should wrap up the normalization phase and will then move on into the detection phase which David's going to take over for
oh thanks Brian so going back to our original architecture diagram uh thank you Brian for covering the left half which is the very complex phase of you know getting a lot of different heterogeneous data sources and placing them into a single bucket where you have a nice source of Truth and right now we're going to focus on the right side of the equation which is what do we do with this data from a detection response function when it's actually flowing into our kind of data Lake so taking kind of one quick step back uh you know what is the detection blue team 101 really we're looking at some sort of data source and trying to identify
whether malicious events are happening that somebody needs to either respond respond to either automatically or manually and for us we kind of have broken it up into two different classifications we have streaming style detections where you're looking at events as they come in one by one a good example of this is you know you're looking at Network traffic you have a host which has reached out to uh some IP or some domain that you know is associated with a malicious actor that event in and of itself that Json payload is enough to tell you that hey something is wrong you can look at those events kind of one by one they have self-encapsulated context a bit more
complicated is the batch detection where you're actually looking for additional context and addition additional information of the same kind of events over time a really good example is the MFA fatigue attacks that have been happening uh pretty frequently and we're in securing you a couple months ago but essentially if you think about detecting for an attack like that where you're consistently having or you're having a user who's consistently getting MFA auth requests if somebody fails an MFA auth request one time that could be normal right you hit the wrong button on your phone your face ID doesn't work something happens but if you see activity where you're having a user consistently failing it three four five
times in a span of a few minutes that might indicate a little bit more that something bad is actually happening so um we have kind of these two different categorizations for detections that we look at uh really want to talk about how we manage detections as well uh there was actually a panel right before this which uh seemed great I highly recommend checking that out that kind of covered this topic in more detail uh we just wanted to touch it really quickly so taking components from software engineering principles Brian and I are software Engineers by Nature we're Builders at heart spent a lot of time kind of in those kinds of workflows and for us it was really really important to
kind of take those principles and align them to our detections as well so if you think about detections not as a detection but as some sort of software service and you shift your mental model a little bit there's a lot of parallels that will happen so you want to be able to write repeatable detections you want to have a centralized source of Truth for them you want to be able to test them upgrade them roll them back in case of a bug and you also want to be able to promote them across different Dev and prod environments so by the time with detection or your software service gets to a production environment you should have full confidence and its ability to
do the job that you wanted to testing both in unit tests and integration testing is something that we really wanted to have as well to ensure really high Bar for our again software services in this case detections so wanted to walk you through kind of the detection workflow that we've kind of come up with that has that we've built out has been working pretty well for us so I'm kind of skipping the initial phases of the detection life cycle where you would gather your requirements you'd come up with a hypothesis this is more when you've kind of have a little proof of concept and you want to start working on a tangible detection uh so we start off in a Dev environment
we purposefully have a delineation between our Dev environment and our production environment again just going back to that testing story you can make changes you can try new things out without risking any Downstream systems we have two similar data flows in both our Dev environment and our private environment to keep costs down we do data sampling in our Dev environment but you still have a very real stream of data that's coming in uh you know with certain contextual requirements if the data is okay to be in Dev and then that gives you a really nice environment to test things out uh prototype things and again without having the risk of impacting something in production so you do your local development you
write some code next thing that happens is as with the software service you're going to write some sort of unit tests unit tests get committed to a GitHub repository that kicks off a deployment uh and once the deployment happens we also have an additional step of continuous validation so if you think of uh you know a web service or or a website it's pretty easy to know when issues are happening the website won't load uh latency is super super high maybe there's error rates that are happening on the back end uh but for detection you don't really necessarily know how often it's going to or not going to fire in fact for some of your
very high fidelity detections ideally depending on the environment you're in they shouldn't really ever fire at all so we really wanted to have some sort of continuous validation system to ensure that the detections that were written you know one two three years ago maybe by someone who's not even on the team anymore are still doing the exact job that they were designed to do from day one so if all of these steps pass and the noise level is acceptable continuous validation is good we will simply do a promotion process and deploy it in our production environment or we still get the continuous validation consistently so I've talked about this continuous validation step a couple of times and I
want to dive into it a little bit deeper um one thing I also want to call out is that when Brian and I were building the system we were kind of faced with a fair amount of work to do to go from you know from scratch to something functional and for the detection engine we kind of needed to figure out if it was something we wanted to build or something we wanted to buy for a variety of different reasons based on engineering constraints and a couple of other factors it was also really important for us to be able to immediately deliver value to the business so as the business is investing in a detection response function we
needed to be able to kind of show value pretty quickly and so we chose to kind of buy a detection engine so that we can build workflows on top of that gave us a nice Foundation to get started and let us invest in some really really neat efforts to guarantee a high level of service for instance continuous validation so on the detection Health System I think I got a little bit ahead of myself here uh but essentially your deductions can only help protect the business if they're actually functioning and if they're actually working uh unit tests are great when people talk about detections as code there's a lot of talk about unit tests which is fantastic but
they're not necessarily enough to go from a raw log to a response action all the steps in between there's a ton of different interconnected components you can have bugs you can have bad deployments you know something can be failing along the lines that you know you might not have monitoring for you might not have thought to build monitoring for so we really needed some sort of fully functional end-to-end integration test one other thing for us is we want to keep in mind that writing detections is part writing complex detection detections is hard you go from the requirements phase you go through your prototype you build it you test the noise level you tune in the last thing
we wanted to do was come up with some sort of process which would you know upset detection response engineers and want them to bypass the testing process so we wanted to build something which was low friction easy and would make our DNR Engineers want to write tests because it would give them a benefit versus something that you know they would just have to do because we put a check box and then they kind of stopped doing it after some time so our detection health system has uh two different components um the first is generating Canary alerts so what we do is we built a system that takes synthetic data uh fires in into our detection Pipeline and then that flows
Downstream there's a couple of different components here you'll notice uh very similarly we have a event Bridge rule which kicks off a Lambda on a Cron job Lambda has monitoring with Cloud watch alarms all the built-in native Integrations again taking a cloud native approach has been extremely helpful for us we put Canary data in an S3 bucket that the Lambda will read from and then it will fire into our detection pipeline which Kinesis fire hose it will take the data it will send it into our centralized source of Truth um S3 bucket what we do with the canary data is we mark it in some way to determine that it is actually Canary event if so in our Downstream automation
Downstream processing typically this will be a soar platform we short circuit so we make a note of that event but we don't generate anything that a human would need to interact with we don't cause additional alert for you know an analyst or a DNR engineer there's no extra work that's generated from this so it only really raises noise of canary events stop firing if it's not a canary event if it's a real thing of course we don't want to get in the way of any alerting there so it just proceeds with the regular flow uh one other thing I want to call out is the reason why we chose to start with synthetic data rather than building a bunch of
different environments to kind of write scripts to generate real data is due to the heterogeneous environment that we operate in uh Brian alluded to it with all the different data sources SAS companies so lots of different environments and Integrations rather than spending the time to kind of build out and mimic every single environment every single offering that we wanted to keep track of we felt that we would be able to provide value more immediately and faster in achieving our goal of kind of maintaining a high bar of detections by using choosing to use Canary events down the road the intention is to kind of take the most common environments and swap out the canary events for real
events that's some future work that will be done at some point the second component is actually sounding the alarm or being the canary in case a detection stops firing so every single time a detection fires it gets written to a detection table which is actually also used for our batch detections so there's a record of all of that a Lambda will query this table with a cloud watch rule consistently on a cron it will take these metrics and report them as cloudwatch metrics cloudwatch metrics will have alarms tied to them so if for some period of time hours days you know whatever your threshold is there will be an alert that fires if there's no Canary event that
has run through uh so what we did was we took kind of all these two components and we abstracted it away in a terraform module very similar to how Brian talked about having a terraform module to allow for easy repeatability for onboarding new data we really wanted to maintain kind of a similar approach for these uh for the detection Health System again just being mindful of the fact that we don't want to get in anyone's way we want to empower people to take advantage of this kind of free testing so all it takes is instantiating a terraform module it's like four lines of code and uploading a file to S3 so very very low friction you
get free monitoring for your detection knowing something's wrong the next section is called alerting but it's actually a trick it's not necessarily alerting yet so just because you have a detection that's fired doesn't necessarily mean that you're ready to generate an alert and the reason for that is how much context does your detection have that's already fired uh context is key because if you just have detections alerting humans or sending stuff into a queue very quickly you're going to hit alert fatigue you're going to have a huge backlog and it's not even going to be helpful you're just going to have too much stuff that's firing a lot of it is probably not even important or is benign so you need
context to be able to filter things out and suppress them accordingly I want to walk you through a basic enrichment example of how a detection can fire but by enriching it and getting additional information you can triage it a lot faster and have much better understanding when someone begins an investigation on the screen is a sample guard Duty alert so this is not a real alert if you use the service you can like click a button it will generate some fake alerts you can see the ec2 instance ID is not real but in this case it's simulating a real guard Duty detection firing also guard duty is Amazon's threat native threat detection service so you can see that you know
there's an ec2 communicating outbound with a known C2 server I blocked out the account but there's an account number in there and you kind of have a description of what's going on there so when this alert fires if you see it and you send it to someone to take a look at you know something is wrong right you have some sort of host it's communicating with things that shouldn't be communicating with what's going on but the immediate questions you're going to ask are what is the cc2 doing um whose ec2 is is it important is it a build server is it like a one-off kind of research thing is it a production server we're taking down the server will
impact a production workload and you have to take a completely different set of response steps there's a lot of context that kind of gets built in who owns the cc2 who's the service team what kind of stakeholder are you going to be working with you have very similar questions around the account portion who owns this account again who are you going to talk to how important is this account is this a Legacy account that's been forgotten about is there extremely sensitive data in here to the business or from compliance perspectives where all of a sudden you know this is P0 hands on deck uh lastly this one is a little bit more of a stretch goal I guess but if you
have thread until feeds that you subscribe to or maybe more mature thread Intel capabilities you can maybe track the IP or the domain and say hey is this a so is this associated with the threat actor that we're tracking have we already been hit by this you know threat actor during a different campaign what do we already know about this so that can be helpful as well uh Brian touched on it earlier but the way that we do this is with our enrichment architecture so again to add context into detections when they fire uh prior to an alert just being created there's a couple of different a couple of different steps here but the main
building blocks are the same ones that we've been demonstrating throughout this entire application so we have an enrichment data source again it can be external it can be internal you got data that can be useful somewhere and we query it with a Lambda on a Cron job in which in AWS is an eventbridge scheduler so the Lambda will take this data it will write it to an enrichment table which in our case is dynamodb the reason why we chose it is because it's great for unstructured data it's easy to use scales has really easy Integrations with things like soar platforms Etc just gives you a nice little hook to query the data Brian actually wrote some
really neat code to do some deduplication between data that comes into that enrichment table so making sure we're not just consistently writing the same data over and over again we're only doing updates when there's a change in whatever enrichment data that we're recording and some neat sequencing for different point in time interactions as well the rest of the steps are kind of to convert the data so in our streaming alert and SQL Search tool to integrate this kind of enrichment capabilities it expects the data in a CSV format so we have some functionality to take it from this kind of source of truth dynamodb table convert it into a CSV and feed it into our streaming alert and SQL Search
tool so that we can take advantage of this data as well so now we're at the investigation phase so we had a detection that fired we enriched it with some context uh we decided to generate an alert we're not going to suppress it and then now we're at the investigation phase so continuing with our guard Duty example we still have some questions for how we're going to do this investigation so we got some more context but we still have a list of questions that we need to answer and this is more of hey if you have an investigation that's going to happen most of the time depending on the maturity of your program what your environments look like
there could be a lot of uh maybe basic things that can be a lot harder than you think for instance do you have access to this AWS account to come in and take a look at this ec2 host fired an alert can you even get access to the ec2 do you have SSH keys do you have SSM do you have some other way of interacting with the Box do you even have an IM role that you can use to take a snapshot of the EBS instance if you want to do forensics on the machine in AWS it's not as straightforward there's a couple of different steps along the way and when you kind of want to take a snapshot of
it you want to also boot it in some sort of isolated environment so if there's malware running on a host you know we just want to take in start running it in vpcs inside of your network you probably want to create some sort of isolated environment maybe you have some pre-installed tooling on a workstation you can do forensics on uh you know pcaps and all that so a way that we kind of think about this is if we fail to prepare for these kinds of Investigations uh we're not really going to be supporting our DNR Engineers or responders when investigations come in so at the investigation phase again when a human starts to look in alert this is
typically where you're going to have a lot of bottlenecks because it requires manual effort again you know you're going to have some Automation in place but eventually you're going to have alerts that are going to come in that physically require a human to come in and take a look at so what you want the responder to be able to do is to answer the questions and finish the investigation instead of getting bogged down and things like how do I get to the cc2 how do I get to this account so the way that we do it is we try to have a mentality of ruthlessly automating everything that we possibly can if it takes more than a couple minutes or if
it's something that's painful or hard we build out some processes to save time and more importantly minimize mistakes so really make this kind of conscious investment in setting our responders up for success one way that we do this is uh by building a forensic workstation so what we do is we Leverage The Amazon's ec2 image Builder service and we kind of create this workstation that any analyst or any person on the security team has access to in a security forensics account so we create this ec2 we boot it we create an Ami we load up all the software that's necessary to do these kinds of forensic workflows then we publish it we tag it make it available
to whatever work streams needed or if someone just wants to boot it attach an EBS volume and then go to work this diagram turned out much better on a big screen than I thought so pretty stoked about that uh so the other thing that we do is we actually decided to automate forensic extraction so going back to this guard Duty example where we have an ec2 that fired you know we want to do some sort of research on it answer some questions um there's a lot of steps in AWS if you have an arbitrary account and this alert Fires for an arbitrary region you need to have a role that can take snapshots of these EVS volumes you need to copy
them to the right region you need to encrypt them you need to have the appropriate KMS access keys so that your security forensics account can decrypt the EBS snapshot and then mount it onto an ec2 again you want that forensics environment so that you can comfortably boot up the ec2 and there's just a lot of things involved that can take honestly a couple hours if you're going through it for the first time and you're not super familiar with the environment so we wrote some tooling around this we wrote some scripts to take a process down from a couple of hours to a couple of minutes where the bottleneck is not access to your AWS resources knowledge
of AWS or anything else the bottleneck is just how long does it take AWS API calls to execute you get a forensic workstation booted up with these volumes attached you can begin your investigation without having to worry about anything else uh if you've made it this far uh to the response portion uh congrats uh through the day through this talk and also through your detection response function so now actually is where the real work begins right so you have to fix whatever is wrong you have to assess uh whatever issues have come up you have to deal with the ramifications of it um you have to do the fire drill of getting the right stakeholders in place
following your run books etc etc but there's one other really component a really important component of the response piece that I want to call out which is remembering to evaluate your detections uh this is a detection life cycle uh this image is not mine I took it from the snowflake blog they have a really great article about this which I really really liked and so there's a component in here which is called monitoring your detections so we've already talked about the continuous validation phase where we have some sort of integrated testing to monitor our detections make sure they're working and this isn't monitoring in the sense of hey I want to see how performant my code is running what the
latency is this monitoring is from the context of how effective is this detection how noisy is it are there additional signals that we could have inserted into the original detection that could have saved a responder time later in the investigation so even after the response phase kind of finishes Brian alluded to it earlier at the start of the talk in the overview but you really want to make sure that you kind of go back and maintain these detections as you would maintain a software service over time as it's running so Brian and I spend a lot of time on this uh and we're pretty proud of what we built uh but we also had some
learning some things that went well some things that didn't go well that we kind of wanted to share uh some things that have been really successful for us are automating onboarding of new data sources so just making things as fast as possible so folks who aren't necessarily as comfortable with terraform maybe as comfortable with python just don't have time to do it we don't want to be blockers for them to onboard new data into the pipeline for their own use cases scale has been great again taking a cloud native approach lets us scale really well very cost effectively uh notably with the Lambda and the sqs following the detections is code Paradigm and taking software engineering
and applying it to our DNR function has resulted in pretty well tested and high quality detections where we have very high confidence by the timeline detection ends up in production that it's going to run something is continuously checking looking after it um and yeah overall just building a lot of confidence and enrichment system is something that's been great for us just adding that content next helping us get through investigations faster and able to prioritize things that come into the queue some things that uh we definitely want to improve on over time is empowering folks again I outlined this as a positive but it's also still a work of improvement or area of improvement that we can work on is uh onboarding new data
can still be sometimes depending on the data source a high touch process so we want to make this as self-service as possible so there's some continuous improvements we can do to make onboarding data even easier I want to continuously improve our CI CD story and this is mostly for me uh but uh have hit some parsing struggles I wrote a regex which wasn't great some time back and so just making sure that when we do those things and we Wrangle a log sources that are a little bit Messier we take the time to kind of do it and flush it out as much as we can before deploying it anywhere since we've built this system and have
the opportunity to kind of present this there's been a couple of other alternative approaches that have come out or some other systems that have come out we haven't used any of them they all seem really cool this is not a vote of confidence for any of them just something that we would look at if we were to rebuild the system from scratch again AWS has an offering it's called AWS security Lake its goal is to centralize a bunch of data marketing is really really good what they do is they leverage ocsf one of these security schemas that Brian called out at the start of the talk opened cyber security schema framework to help out with the
log normalization purpose uh per log normalization aspect of it so you have this nice kind of centralized data Lake if you want to use that term where you have a schema in place uh matano not sure if I'm pronouncing that right this is open source version of it and also a detection engine on top of that so it's really really neat if you look at the GitHub they have architecture diagrams which look similar to what we've built so that was really nice validation for us in terms of the approach that we kind of pursued and they leveraged the elastic schema elastic common schema for their log normalization and they do something really cool they leverage a
vector remap language to normalize logs so kind of taking that compute portion and the normalization it's a really neat way to do it so highly recommend checking that out if you're early on in your journey lastly this is more on the detection validation side but datadog released a tool called threat test it also integrates really nicely with their like attack stimulation platform where we can fire up uh detection that's mapped to miter you can execute it and then you can use this thread test framework to make sure that alerts fired on this specific workflow that you kicked off seems really really neat so to tie it all together we started off with a need to go from a raw log to
making a security decision and it sounds pretty simple and it is at lower scales but as you get more data sources more scale it can start to get a little bit more complicated so we walked you through kind of the six different phrases you have the raw data normalization detections alerts investigations response there's a lot of different work streams that you can take along the way to kind of make this process as high quality and as useful as possible for the detection response side and for the business as well so we definitely didn't cover everything but hopefully this can be a helpful blueprint for building out a scalable and cost effective threat detection platform with a high bar for quality and
reliability and with that I'd like to thank you all for your time for coming here and would like to open up the floor to any questions [Applause] not a question yeah uh the question was what detection engine did we use um we we purposefully left that out because we didn't want to endorse or turn this into a vendor talk I would be happy to answer that literally uh right right after this uh next question yeah
so um right now we are kind of peaking in the tens of thousands of events per second which is not that big but we do have every expectation that this could grow to you know millions of events per second if we needed to question the question was any plans to open source any part of it um I have to ask the boss I think on that one uh at this time not that I know of so um there's not any open source yet but there is I did publish a blog post on thebenchling.engineering site which is our blog um which does cover a very tiny piece of what we used which is a jwks exporter
for KMS asymmetric keys so again just just as kind of like a breadcrumb of we're not entirely opposed to it but we're just kind of Dipping our toe yeah I have another question uh don't see any other questions uh but Brian and I will stick around right after so thank you very much again for coming to our talk I hope everyone has a great weekend great conference thank you thanks everyone
Related talks
 20:40
20:40 46:38
46:38 47:24
47:24 30:48
30:48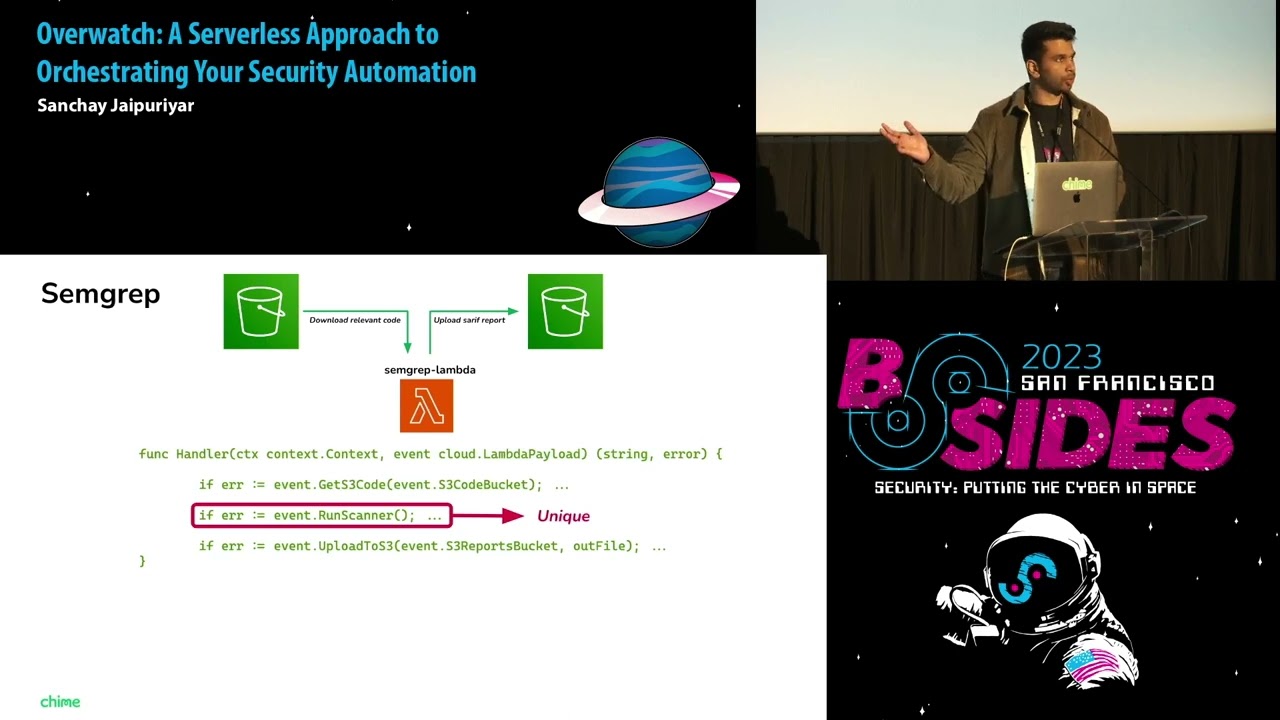 27:37
27:37 46:31
46:31