Where's Wally? Hands-On Thread Hunting In Elasticsearch Using EE-Outliers
Show transcript [en]
you thanks everyone for attending after the coffee break I hope you're really awake I have a bit of content but I try to keep it very hands-on so indeed my talk is about hands-on threat hunting and elasticsearch this year I open sourced a library or a framework to help you it is it's called e outliers the talk will be about a few of the concepts or the principles that I I implemented and the reason why I did it so yeah the introduction was I think pretty complete that's a picture of me with my little sister and little version of myself I learned to program at a young age I really loved it I'm pretty sure that we playing Jenna in the jungle
there on the slide and indeed I'm in charge of an visa lap so that's a research part of an visa we're a boutique cyber security consulting company located in Brussels about 60 people and we just opened our small offices in Germany so what would I like to cover today I want to convince you of the benefits of using statistical outlier detection I want to introduce a framework to you I want to show you few examples how you could use a framework to threaten to cross the entire yeah attack lifecycle and then of course kickstart you on how you can use this yourself maybe a first show of hands who is using elastic search or the iake
stack in their environment you know I noticed that there were four talks today about so almost half about elastic search so that's quite impressive so let's dive in why do we need statistical outlier detection or where the strut hunting come from I think this is pretty clear to most of you but the small recap first of all detecting known bad stuff using a signature can be analyzed relatively easily I maybe should have put that between brackets but still we have very good Sigma rules Yara I use these ideas heads we have platforms like mr. to exchange information if we fine-tune our rules and that's not always easy we can have a pretty low volume of alerts that are manageable to
go through now on the other hand if we try to hunt for malicious activity that cannot be converted into oh it's a very simple detection rule it takes much more effort to do this and it requires some statistical analysis to put this in perspective I would say at customers where we do try to hunting and security monitoring if we collect let's say a hundred million events per week we might have a few thousand alerts that somehow we need to triage in first line whereas for behavioral analysis if we don't have a very robust way statistically of looking for outliers so for stuff that diverts from the baseline from normal user activity you can literally start
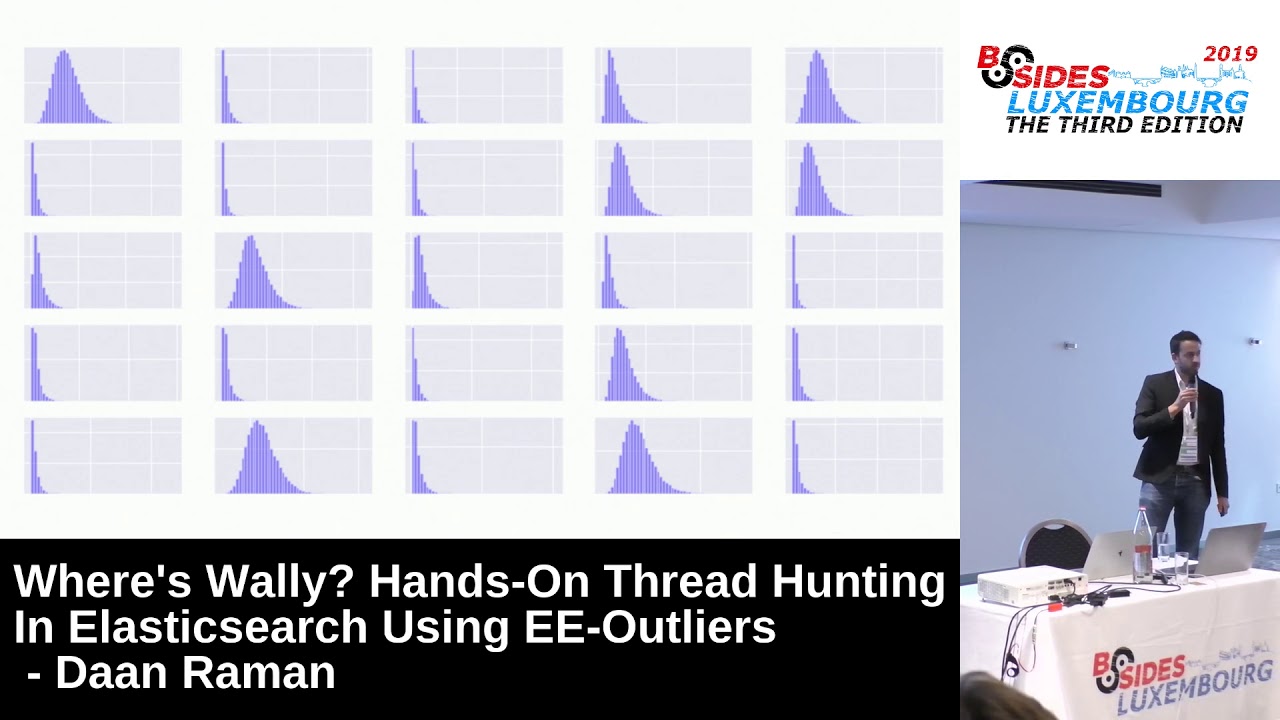
looking at the first event and end with the ten million or the hundred million it's just impossible to do to do manually and there are some I would say cheap approaches and approaches that are typically taken by threat hunters to look for statistical outliers and who has looked at this type of graph in your environment where at one point you aggregate length of domain name or okay well in this specific case I dashboard the distribution of the length of command line parameters across all the running processes in an environment I think over 24 hours just as for sake of the presentation you typically have this normal like distribution and what's then often a reflex that we have where do you
start looking any IDs or any experience
yeah at the big bars yeah what would you find there like stupid is very often present or that's very yeah so in this case what we look at this around command line length 70 or 80 there's really a lot of different processes so actually if you look at command line length I would say it most often for this specific case people would do a long tail analysis and we'd start looking in the deels based on a metric calculated across all the looks for example the length of the command-line arguments now there's definitely interesting stuff you can find there and of course the the reasoning behind this is that let's say we have a very long command line
parameter for a certain process it might contain an interesting payload for example so that might work but I just took an example from our own environment in our own company and you can see here by the way I'm using the super cool clicker from Sofia so I will use this I have that command is actually the legitimate execution of slack on my own computer so in terms of command line length that goes well over the 200 characters and there's just a whole bunch of parameters or configuration flags that are passed directly as a command line to slack I'm not super sure why they do it this way most of the tools directly read stuff from a
configuration file and then don't relaunch slack but this is like we're talking about so that's legitimate it looks maybe a bit abnormal but it's legitimate but by grouping all the processes and the the length of the the command line in the tail on one graph we might have missed that one so that's one of the big bars where there might be hundreds and thousands or millions of events that we need to go through so really impossible in this specific case does anyone recognized the payload the PowerShell payload what does it do small pop quiz yeah exactly this is a very standard payload that is generated by the Empire framework so indeed malicious PowerShell now in this case it was
hidden somewhere in the middle of the distribution together with probably hundreds of thousands or millions of different process execution events so the analyst manually is not going to go through this what's maybe a better approach is to not plot the distribution for every process combined but to do this for each process separately and this specific case I plotted the exact same data but I only extracted all the information from PowerShell execution and then you have this distribution so very different from what we saw previously and we basically see that a lot of the arguments passed to PowerShell and this specific environment were much smaller than the average across all processes typically around 10 to 20 characters or words and
you see one big line here in the hundreds and that could be our malicious payload so in that specific case it became very obvious by just generating a new graph where we took a slice of the data and we only looked at PowerShell that there's something very interesting going on that we we need to look into now visually we can see if I would ask you which of those bars is malicious even without coloring them you would pretty quickly tell me I would like to look into this one right and not the big the big faction showing there on the on the Left we can ask a computer to do this automatically without visually inspecting this with very basic
statistics like standard deviation mean average deviation and so on this is the core concept why we built outliers so the framework that we built it's to automate this process so imagine you have this concept you do it for PowerShell and it works well it's pretty nice I could just as well do it for slack for PowerShell for CMD dot XC for Outlook dot X C obviously there's potentially thousands or millions of those different graphs you would have to create this is maybe still doable in an afternoon this becomes more complex and this becomes impossible I think as an analyst if you let someone generate these graphs you go nuts within within a few days so building these type of
statistical models or matically and looking for outliers that's what we wanted to do automatically and that's why we built outliers so introducing outliers that's the the framework name what is it it it's a framework that offers you a set of statistical building blocks or detection models that can be used to convert the theoretical threat hunting use case or a hypothesis into a working detection okay so something that you can actually run against an elastic search cluster and get results this is something when we started developing that we really missed in our hunting approach we were spending way too much time crafting our own queries making our own dashboards filtering on a certain process name like PowerShell recreating
everything manually looking for outliers which takes a long time so we wanted to avoid that I'll give you an example so this is a dreadful thing hypothesis something that any threat hunter could come up with and we say the hypothesis is that an exploited process is abused to spawn a malicious process in order to take control of the system so we've all seen this case where there's for example a vulnerability and Adobe Reader just taking a very random application where it spawns a few processes across for example that the period of a week and we're one of them cmd.exe I would not expect to be spawned by Adobe so something I would like to investigate
you can see already that this principle if you want to put that into practice in elasticsearch we need a type of concept that I Ellis traited before where we make the type of analysis for each and every single process so in this case one analysis for Adobe another one for Outlook for slack and so on so how does it work I'll show you one example of how a configuration file in the framework and II outliers looks like so we can very easily create just this block a config file it fits on the slide so first of all we define all the events you want to consider in this case we just select all the endpoint events it could be a bit more
fine-grained for example all the process execution or the season stuff depends on your your cluster an aggregator and a target and then a way that we want to count the different events and that's really at the core of the principle I showed you before this is the way we implement it in the config file so building those statistical models the graph that you saw that's what we are defining here so basically we say the aggregator that's the parent name so I crobat for example and cone host the target so that those are the small buckets below those are then the names of the processes so parent-child relation and we want to count those instances within the aggregator so that
basically means that we put the big wall in between the different processes and we want to do an individual analysis for each of those the fact that there is a line between them you can imagine that each of those so acrobat and cone host represent a different graph from my first slide so that's really all we need to do to statistical defy statistically define or or or model then we see what are we interested in when do we want to trigger an alert to show to the thread hunter to investigate we want to trigger if the amount is low so that the trigger on condition so we only have three events here and then a method and a
sensitivity so there we will look at the average across all the buckets again only for that process so that's the the concept here and the sensitivity is one so in this case we save the average of the events in this case three is is lower than 1% of all the buckets then we will tag the event and we will tell the thread hundred this is maybe something you might want to look into we can add a bit of sugar to the event so this is just human readable information we will tag in the event it's not used by the algorithm itself but whenever we have a hit we will then say hey tag it as
process execution in our environment we also add my tree technique references there now for example t 244 lateral movement the reason why I triggered to a rare child process and then the summary it can really contain placeholders or the actual values of the of the events a rare child process for example cmd.exe from the example for adobe reader dot eggsy then we have a simple flag that says either run it in production mode so write stuff to the cluster or just test it and show me the output under under the interface in the konso this is then the result just an example the philosophy is that we never delete or create new events we just mutate them so
we add new fields new dictionaries to the event that all starts with outliers and you can see for example the outliers dot the reason that we just defined I had to black out a few things a few IP addresses and so on a summary and then a whole bunch of other metrics that can help the analyst to for example determine the statistic the statistical confidence of an overhead so how confident was the model that this was indeed diverting from the baseline now small Intermezzo on how we do this in our own environment we collect all the endpoint looks from all the laptops that we have it's about sixty in our in our company we use we have really depend
on season and OS query for this we have a network tab in our office but most of our people are consultants who are on the road so we rely on and pointer if there's too many people at the office it means we don't have work so that's a bad sign so we go for OS query we dump all of those events and elasticsearch they are enriched with asset information with country information and so on and then basically we have a whole set of use cases just like the one I showed you but about a hundred that we define for our own environment that are then ran historically through Yee outliers that say the last seven days and that we do
each day and the only thing it does it adds new tags to the event so it's never going to delete or insert new new documents it's just updating what do we do with it well we dashboard everything in Cabana we still loved the Alex tag that we we get and for some of the alerts we have a last alert implemented to have a case in the hive so if it's a high confidence alert for example a very rarely observed scheduled task on one of the the employee workstations that's something that can trigger a case in hive we don't do that for everything for example we have a very robust model that detects statistical beaconing the problem is the
model doesn't really generate false positives but there is just a lot of software that shows beginning behavior like Azure telemetrics and that becomes very annoying if it generates 10,000 use cases over overnight in the hive and I mean giant very important the human feedback loop so we build in a system into the the tool or the framework to whitelist certain patterns and it's not just a dumb literal whitelist you can do that but there's also regular expression way of doing it where you can combine multiple fields or multiple observations for example beaconing observed for domains that are very popular in my environment ignored those or don't tag them it can severely help with you had
alert fatigue that sir we talked about earlier and also the models learn from the observation so the human feedback loop does not it's not simply an input to the tool but it also helps to improve the statistical accuracy of the other models that's a feature we added I think two or three months ago so the result is really the dashboards you're used to so we basically just filter on all the events that have a certain tag called outliers and then we can dashboard all those news new fields that we added you can still have very traditional lists like you see on the left it's a table with all the reasons there's already few they're like a rare outbound connective
diera hash deanna sterling you can see an example of a reference to my tree that we put there and of course look at every correlation on the dashboard itself so you built a few basic outlier dashboards for that and you're good so that's the the concept that's the way we built configuration files how we convert an hypothesis into an actual working tool I would like to give you a few examples in the next section on how we use this successfully at customers to hunt across the kill chain so different phases that you're probably familiar with I'm still using the kill chain and we're in a my tree house and we also love macho but this is just a bit easier
sometimes to show on the slide so let's look at a few examples so reconnaissance and exploitation the hypothesis and attacker will sent requests in a very unexpected format to a machine and a service that hosts the hosts sorry in order to identify and exploit vulnerability so basically we want to look for signs of an attacker shooting crap at a service that looks different from the other normal accepted service requests we can create a very simple outlier detection rule again I'm not going to bore you with all the details again I think I got got the concept across let's let's just look again at the three it builds or the different aggregators at the top level we put the
wall in between all the domains that are being queried so in this case we're trying to detect web server text so a b c dot b e we make another bucket in the model for every single pot so every single page that is being visited and you can imagine that we are for example hosting a CMS we expose it on the internet wherever we want to monitor if someone is attacking it so in this case a b c dot b e has two parts on the slide it has CMS slash login and then a logout and then the last buckets or the last complexity that we add to the model as the actual URI so for the I just deep dive on to
the logon you can see on the left a very legitimate query so just a logon with the user ID and a password that's it and then on the right you can see something that very obviously looks like sequel injection now this is probably a bit overkill to do with threat hunting and with statistical analysis I mean you have a lot of ideas rules for sequel injection but that's not really the point of the slide it's more to show how versatile it can be the model has no notion about sequel injection as a matter of fact in II outliers there's not a single reference to security or to threat hunting so you could just as well
use this for marketing or for for any other purpose so in this case we have that suspicious yeah request and what do we use in this case to spot for outliers the Shannon entropy so it describes how much energy or how much information is there in a single request it suspiciously higher then entropy off in this example just to request but it could be a million so we can again generate an alert this can be very effective in hunting for all types of injections so I just showed sequel injection we use it to detect path reversal command injection and so on brute force is also very nice one which will very often be quite noisy in the
log so again the energy of a single page or an a source IP will go up and this will bubble up in the the statistical model second example that's more the exploitation and the installation phase the attacker will use of fisk asian airline legitimate system admin tools in order to install and hide their malicious activity so think of powershell the standard command-line tools that you have in an environment that are used by your C's admins or your network admins but that are also abused by by the attacker I don't bore you with a config file I'd just jump to the use case and a graph form at the top again we put the wall in
between the different processes so we say we want to do an analysis for each and every single tool in our environment so don't cross analyze across all of the different tools what you would typically do as a manual analyst the next one is user division so let's say we have the data we have some asset in for an hour and our events let's say the US branch and then at the bottom we have the the command that is executed so in this case PowerShell install printer and then a payload that looks pretty yeah pretty fishy or pretty suspicious with an encoded payload that is is malicious another metric that the model will use here is the length of the longest base64
encoded part of the the request again it has no notion of security just looks for encoded stuff in this case 420 will be much higher than 0 or the average of all of the other requests so something we can alert them now the nice thing is this just shows the example for PowerShell but imagine any other tool that you have no clue about existing in your environment it will automatically alert again because the analysis will happen for each and every process that can go into thousands or or millions few examples so looking for file as malware this is actually one of the use cases that we have successfully used to detect Empire payloads at our customers and or
in our own environment for testing and a office occasionally all of your looks we use this also to find for example remains of keys and log files where the model says hey for the process open SSL I certainly see a very high entropy on a command line parameter every set hmm that's pretty strange it was actually someone pasting in a private key on a command line which has supposed a very high entropy and that's the kind of stuff that if you would build in a static use case I would never think of to to look for that an example again legitimate way of java launching on my computer i decoded the payload before showing it on-screen
it's you didn't have any any passwords in there and this again shows the strength of doing that analysis by pocketing certain processes in this case if you would do this on a single dashboard this would fly out and alert like crazy however if the Yahveh process is observed to be launched like this on for example all of the employees computers then the model will be silent it will learn this is just baseline behavior of Java unless obviously your entire environment is breached before you start working with this tool and it will not flag them as being an outlier third hypothesis we move on into the kill chain so command and control a compromised workstation and a server could communicate to a c2
server through low volume weakening requests who is familiar with beaconing or the concept of beaconing yeah who has successfully spotted beaconing that's more of okay interesting so still a very popular technique the attackers need somehow to reach out to their home base either to leak and forth to get commands so we are very interested in seeing this same principle I think you get to know the concept in this case we don't look at the process at the top but at the domain name below that we book it by a host so basically who visited a certain domain with an internal IP and then the next book it is no longer a technical indicator like a command line length but
just a bucket of the hour when an event happened in this case you can see that the TeamViewer subdomain is visited quite I would say monotonously and if you look at the our buckets 10 times at atm 12 times around 9:00 a.m. and so on so the mean average deviation that indicates how different those numbers are is very low so it looks like an automated thing something that every six minutes or so is sending something back whereas in the example of Google to request that ATM so people start arriving at the office ninety requests at nine a.m. people start doing their job aka googling and they mean every TV ation across all of those is just super high so it means it
doesn't look automated it looks really like user activity perfect and this is actually not just an example it's something we found in our own environment so we don't have TeamViewer on our computers at an visa so I saw this specific Alert triggering for that domain I just think I just office keyed the number there and I thought hmm and it was the PC of our office manager and basically what had happened so I give him a call us at the others remote administration software on your computer that we don't use and actually your office manager was approached by the accounting firm that managed the accounting software to and they said yeah we need to do some maintenance on
your computer so just install this piece of software now our users are not admins I feel you coming but it was actually a portal portable version of of TeamViewer and I saw that and the looks and it made me even more worried I was like see downloads blah blah blah portable version of I was like the model works but I'm very worried now so this was just the accounting firm so we verified it was legitimate we give a very angry call to the accounting firm and we removed the software they were a bit lazy didn't want to come inside to the office to do some maintenance oh no no the last one so that's actions on objectives we
really at the end of the kill chain now the attacker has a footprint in the environment he's moving laterally in the environment he's trying to define her crown jewels what is hypothesis that the threat hunter can have while a compromised user account will be abused by an attacker to pivot across computers in an Windows network so typically a legitimate account is fished or is brute force or whatever cache credentials so many ways of stealing in an account and we want to track that with a use case I added a fourth layer here and we can go as far as we want in the use case definition we start at the top by the team so we don't start by a
technical indicator we just start making an analysis per team so let's say the development team then we look at a username and then at a user identity so we tell the model don't analyze all of the logins for a specific developer just look for example at the difference between the development account he has so the one he interactively uses and then the domain account to the main admin which is much more restrictive and we tell the model analyze this separately in this case we see that there are quite some visit from Belgium Vietnam and France for for the developer one and this is very typically what you see if you don't do this type of
analysis the type of false positives you have in your environment you will have a lot of people that go and travel they login to their computer over VPN and then certainly as you're in Vietnam yeah but I'm just logging in I'm helping on a ticket blah blah blah and so two hundred events from Belgium 44 Vietnam 124 France statistically this model will not trigger it will say there's too much variety in there so this looks pretty okay however for the domain admin account we saw forty thousand events approximately for the the Belgian office and one hundred twenty twenty for Nigeria while those forty thousands are all coming from a jump host in Brussels and the admins are actually not allowed
to log onto a machine directly with the domain credentials which makes a lot of sense but they need to go through that security host or jump host to do that and this of course stands out like crazy and if you imagine doing the analysis not at the level of the identity but just across all of the locations this would even be probably obfuscated or drown into the event of France and Vietnam that is even lower so it shows the power that you have by having this type of layered approach and your your analysis again imagine doing this manually for all of the users all of the divisions all of the identities all of the locations even for a 50 person
company I think it would take a few weeks just to finalize the use cases there are a few other metrics that we support in the framework and we're adding new stuff you can look for outliers in the length of a value the numerical numerical value but also the length entropy then coded length of fisken the length of the URL specifically and so on there's quite a few more that I didn't cover here so wrapping up and now I show a few more examples where we were successful at customers to find bad stuff reconnaissance so scan behavior host enumeration there's not so much you can do bits though in the delivery part so emails from unlikely sources you can
build a type of model and the delivery targeting VIPs so statistically one group of users certainly gets the same message subject something we want to look into exploitation the suspicious child processes that something we covered in the examples injection attacks also something we looked at file as malware execution again you're a bit useless there in in blacklisting and hash because this is just PowerShell everyone is using it so there it's real behavioral analysis we look at what users do historically and based on that we can make a decision other options that are very nice to have is suspicious scheduled tasks one of the favorite ways of the attacker to gain persistence an obfuscated command and so on beginning
and tunneling we didn't cover tunneling here but you can also look at statistical properties of the size of a packet or of a session that's something you can do and then actions on objective stuff like the suspicious log on countries a suspicious share access I think you you get the ID you can plug in this framework across your at the kill chain a few other features we have or that we're building in you can really find grain say how far you want to look back historically in the framework because this takes a bit of processing time as you can imagine support for email notifications white listing of certain outliers is quite a powerful system and then packing off certain asset
fields so you can actually see if you have a hit on a certain event and there is a few that's called source IP then tag it and then you can dashboard it and you can give it a certain risk score which is nice if you see certain asset that is very affected across all of the use cases or a big part of them you can start by focusing on that asset the last part do it yourself so all of this is open source we're constantly improving this so you will see that the last commits are very recent you can find it on github it's all docker eyes by the way so download put a config file and
you're good to go quite some extensive documentation on github I wrote a few blog posts on how you can implement certain very specific things that you're also doing at customers like TLS beginning detection or the suspicious child process example I give in the in the talk today a bit of the ongoing research more complex means of detecting outliers so the more complex the modulus the more complex type of statistics you need all of the biscayne or just two examples that generate some nice graphs that I could show today so here you're basically trying to map an outlier on higher dimensions and just to what you would typically see on a graph and X and a
y-axis interesting but a bit difficult to debug in an actual use case buzzword bingo so of course you need to talk about machine learning we are actively working on some concept from natural language processing to use this to detect outliers and maybe some of you are familiar with the research from Google and others around to earth to vac dr. vac that try to map the distance between the meaning of words like King is close to queen man is close to a woman and you can basically do calculations with those concepts and for example say King - man plus a woman equals a queen that's the type of concepts that are very nice to reason about in your your statistical models
currently we are limited to a numerical value that you plot on a graph anywhere you look for a for outliers an example how we could use it is for example services dot XE being semantically closer to see windows system32 then to a temp folder right so that's the kinds of concept that we were looking into I finish with this one it's a blog post I published last year it's called going beyond Wireshark so new ways of visualizing network traffic this was just a pretty basic proof of concept but the idea is that we still spend way too much time looking at tables of IP addresses that really don't make any sense to an analyst we look at a lot of events in a
table if I show you this you immediately know which systems are very active if I give you I think this is 500 events visualized it would take you quite a bit more time to know that so we're actively working on new ways of visualizing outliers but also just in general security events I think I'm just within my time so I thank you a lot for the attention and I'm open to any questions [Music] thank you and are there any question yeah yeah hello thanks for the talk I was wondering at the moment so you're on so have you tried to like just use subcategories by grouping you do as a feature and that you draw tried and find
if she can find interesting said itself yeah yeah so it's actually one of the features that I couldn't cover today but it is there it's called a wild card model you basically say don't give a bucket just select all the fields and look for statistical interesting stuff across all of the combinations between a different fields that's there that can take a long time so if you have let's say 2000 different features in a vector in an environment of 60 computers we easily spend two full days to just cover the last 24 hours so yeah but that's something that's there and it has the example of OpenSSL that I talked to you about with a certificate that came out
of this other questions yeah thank you could you please go to the slide where we had the Shannon entropy stuff oh well actually so I tried to know down the numbers but I can't really remember I know that it was 4.14 for the accepted case and yeah so I don't know the exact number but that was a four point something for the the one that you said like yeah that's one that you stay there this is an outlier I can say stop like no no we still have to go for yeah so 492 okay so in this case like you see here two numbers but what would be like the distribution of like entropy is for
normal like how can an analyst stay here yeah okay that's four point ninety two and four for an analyst where do you like because these are pretty close so maybe like yeah exactly it will be better to like scale this up for an analyst so it's easier to spot it yeah do we have anything for that or a different way instead of if you do it Shannon entropy may be a different way to display this yeah I think for the sake of the two things for the sake of the presentation I just show you two requests but you will actually see that if you improve or increase a bit the the length of this or you change just a
username the entropy will be very very close to that one so this one it's a quite quite a big difference so this could be a million different numbers and if there's a lot of clothes values to this then a standard deviation will be very small and it will be very sensitive to this type of change okay yeah sorry I'm sitting on that side so I didn't if you would do it as a manual analyst a nice way to combine with this or a metric is the length of your request you could start just by looking at the long requests and then check the entropy or yeah and work with that or just look at the smaller ones and look for big
entropy then it means there's a lot of information in a small string that's something that can help you but to be honest doing this manually we tried it and I feel that it so that's the reason why I build it into the model yeah yeah I know I just make if I want up ever like to something like that yeah also do you have in the the framework because it's I mean maybe it's popular among people that I talk to but the other value that a lot of people use is Mark Beckett's value from from freak do you have them no it's not it's not in here so the key ones I use this mean average deviation standard
deviation the average it's it's maybe so in someone or something we can talk about because I don't know it said yeah it's so it's using a corpus that you need to digest and then it gives you like a sort of similar Nicolle value but it's based on an actual like dictionary that you need to fit in yeah that's actually one way we tried to change the Shannon entropy into the popularity of numbers in the English dictionary but we actually removed it again the reason was that that one is very tricky because it works on things where you expect words like domain names or splits of domain names but it falls flat very quickly for anything else but it we might consider
another this one the way it works is because Origen he used it for speed up blind sequel injection so that's why I need to speed that fitting up a corpus and it checks like the the likelihood that a certain letter is followed by another lat errors okay that's why it's a bit more like subtool but yeah it doesn't work all the cases but my experiences is better than just doing Shannon entropy requests [Laughter] thank you for sure Eric knows the tool okay just ask him yeah I did that's all I have thank you other questions are you planning to release a list of hypothesis the hypothesis are easy but it's the implemented use cases and so we have a
few on the blog post but we don't release everything that we create the reason is that some customers commissioners to do it but we keep publishing use cases on the the the block honestly it's a very easy format once you understand one use case to build it for your own features it's and anyone who is willing to try it come to me after the talk or send me an email and I will happily help them but we'll keep documenting things and adding new examples okay then thank you very much thank you [Applause]
Related talks
 1:47:36
 42:44
42:44 45:08
45:08 43:46
43:46 24:37
24:37 42:34
42:34