BSidesSF 2018 - Data Driven Bug Bounty (Arkadiy Tetelman)
Show transcript [en]
[Music]
so hi everyone as mentioned my name is Arkady Tuttleman I'm going to talk to you today about data-driven bug bounty a little bit about myself I work as an application security engineer I used to work on the security programs at Twitter and Airbnb which are the two programs I'm going to talk to you about today all right we're gonna use the laptop so the agenda for the talk I'm just gonna talk briefly about the logistics of the programs at Twitter and Airbnb how we actually ran them what that meant for us we're gonna jump into running a data-driven program really the bulk of the talk and I'm gonna jump the gun a little bit but it's the most important
point is you're gonna have limited resources and availability to actually get all the projects done that you want so using this data-driven approach is gonna let you prioritize your issues and measure ROI we're going to talk about methodology and how you actually implement some of these things and hopefully at the time there's hopefully at the end there's time for some questions but if not I'll also be answering questions on peer list so program logistics at Twitter we launched with a single public program sorry we have a single public program this is opposed to using a dual one public one private program that you see some companies do I'll explain that in a second the soft launch was in May of
2014 it was initially unpaid and then it moved to paid the reasoning for that was to help handle the report volume a little bit better a lot of times when you launch you're going to see an influx of reports you might want to have work out the kinks in your process make sure you have your work flow down pat so for that reason we launched it an unpaid program it helped us keep the report volume down once we were ready we move to paid we had frontline triage by NCC group if you've ever worked in bug bounties you know that there's a lot of noise you got a lot of erroneous reports so they would do the first line of
validation any issues that they feel are valid they're gonna escalate to us and we will look at them we had anywhere between four to six ii generis on the program and we used one week rotations so what that means is whichever engineer was on call that week they would look at all of the issues that were escalated by NCC group is valid we would validate them again find the appropriate owner really own that ticket for the lifetime and make sure that the team implements an appropriate fix validate their fix let the researcher know also the on-call engineer would be the one that proposes bug banning payouts and we would review those once a week on Fridays we've paid
out close to a million dollars over four years and had 850 resolved reports so it's a pretty healthy program I think if you want more stats there's a blog post here this is from 2016 but still pretty relevant I think you can just google bug bounty a Twitter or I will post these slides after the talk for the link at Airbnb like I mentioned some companies use a public and private program just to help handle report volume better that's exactly whatever B&B did until just recently so for the majority of the programs lifetime there was a public unpaid program a private paid program as of one month ago in March of 2018 those were merged together into one single
public paid program I think this is always better to do if a researcher submits you report into the public program they deserve to be paid if they found a valid issue but you will get some more noise this way so just something to be aware of for two hours we have hacker won this time they provide a managed triage service for app second engineers to week rotation but aside from that pretty much the same as Twitter and we've paid out four hundred and thirty thousand dollars over three years with four hundred and thirty resolved reports okay so running a data-driven program what does that even mean why would you want to do it what are the
benefits and if you've decided to do it how do you do it my thesis is that data presents half of the value of a bug bounty program half of the value is going to be resolving issues obviously you need to resolve the issues that you receive but collecting these metro around what is the what are the vulnerability classes that you're seeing what are your resolution times winter bugs going past SLA how often are they going past SLA which teams go past SLA which teams introduce bugs how responsive are you on the bug bounty program are you fast at triage are you fast payout all of these metrics they're really important to collect and I think
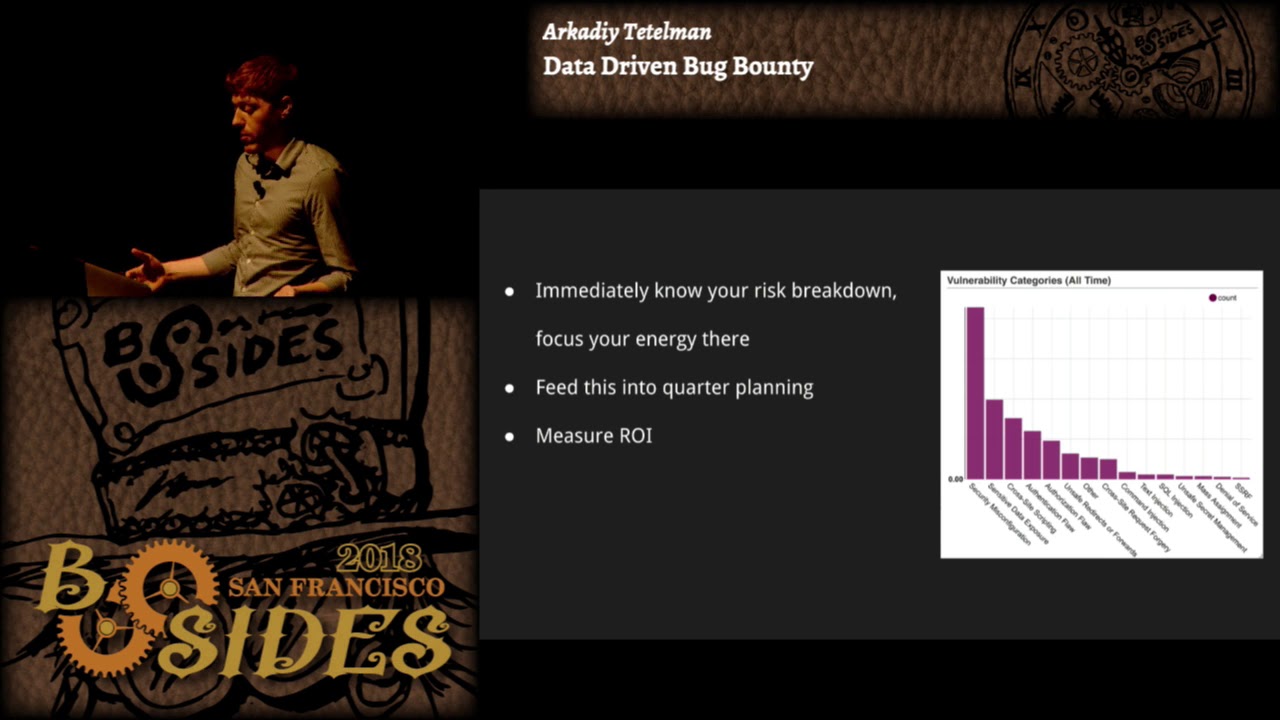
they present as much value as actually resolving the issues themselves so let's see some examples what you're looking at here is a graph of vulnerability classes that we've seen so the x axis labels individual vulnerability classes things like cross-site request forgery server side request forgery cross-site scripting open redirects whatever the y-axis is account so just simply count up bugs that we've seen over time this graph is overall time data but if we wanted to we could also slice it by quarter or by week we could look at week over week data all sorts of slicing so it's one of my favorite graphs I think you immediately know your risk breakdown you immediately know where you need to
focus your energy if you see a spike in XSS or more XSS and a quarter maybe then you can invest in static analysis to make sure you've got output encoding or handling it at the templating layer or adding CSP as we saw in an earlier talk if you're seeing a spike in subdomain takeovers you can add automated scanning for that it really informs where you need to be spending your energy so we take this graph and we feed it into quarter planning we look at you know you're gonna have a an entire backlog of projects that you could possibly work on they're going to be informed by the impact that you think the project is
have is gonna have and the effort that you think it will take to implement the project so having data like this available really informs the impact we know immediately you know the two highest categories here after security Mis configuration are sensitive data exposure and cross-site scripting so we know that that's where we're gonna get the most bang for our buck some of the other lower volume things they might be interesting to look at or interesting to work on but there that relevant for us so let's not waste energy on them you can also use this to measure ROI so in addition to planning out ahead of your quarter what you're going to work on at the end of the
quarter you can come back or maybe wait a few weeks or another quarter after that and measure did the numbers go down did this have the effect that I wanted it to have on my program and on these vulnerabilities so that can be really valuable you can look at did it not have the intended effect and maybe do a little post-mortem about what happened maybe it did have the intended effect but it wasn't as pronounced as you hoped it would be maybe you need to spend more effort on it being able to do that kind of analysis I find to be really helpful so the quarter that I took this screenshot we did focus in on those
second and third categories the sensitive data exposure and cross-site scripting and using this methodology of being able to measure after the fact after we waited a quarter we did see you know the the down tick in the numbers that we want it to see one thing that we'll note about this is that you have to build out an internal taxonomy you have to know what are your different vulnerability classes that you're going to tag issues as what are the different components of the product that vulnerabilities fall into who are the teams that are going to take ownership over that you have to have this extensive tagging system and be really meticulous about tagging all your
tickets the way that we did this is we used JIRA and you can just create custom fields but it took a lot of work to figure out the taxonomy that we wanted and also to actually label everything some things you can automate but a lot of it is just manual labeling and especially if you're doing this after the fact if you've already launched a bug bounty program it can be quite tedious to go back and tag the historical data but I think it's worth it because in the end you got graphs like this and also the taxonomy is flexible it'll change over time so if you'll notice the number one column here is security miss configuration that's
kind of broad it's really just a catch-all for that's why it's so much higher than all the other categories as we see repeat vulnerabilities fall into their will sometimes take those out and break them into their own category like one example I brought up earlier with subdomain takeovers those might be worth splitting out into their own category by now here's another fun graph what you're seeing here is average vulnerability time to fix by team for the last 90 days so the x-axis is individual teams every bar represents a team and the y-axis represents the average time to fix in days for these vulnerabilities so if you've ever done offensive security research or participated in bug bounty
programs then you've probably been on the other side of this graph which is there's a 10x difference between the fastest and slowest teams in terms of resolving vulnerabilities you've probably you know waited many months sometimes more than a year to see your vulnerabilities resolved this is why you know we we try to work very hard to make sure that teams do resolve issues on time but there's a natural distribution there that can be hard to control in addition to time to fix by team we also track things like SLA so open tickets past SLA by team which teams are consistently missing SLA we look at trend lines and changes over time all this sort of peripheral data
the reason this is super valuable for us is that you can hold teams accountable when you see that a particular team is working ten times as slow as your top team that might be cause for investigation and you can sort of drill down into that I think even if you're the most empathetic security team in the world which which we should all you know strive to be you're still gonna have difficulties getting some of these teams to work with you they have their own priorities they have their own roadmap a lot of they might they might just not even care so when you bring data like this to the table it can really help you
and on the flip side of that when the team is doing well you want to give them positive reinforcement that's really important don't always be the bearer of bad don't always you know come to the table and start talking about garbage fires or whatever that's not going to really help the conversation at all celebrate good behavior and that way teams will want to work with you and as a concrete example of this we had a specific team that hit a sustained zero vulnerabilities past SLA which we were very happy with we were working with them for a while to get that accomplished so once they hit that zero vulnerabilities past SLA we threw them a
cupcake party so that was pretty fun this is another great graph the x-axis here represents individual sub teams this time so every bar is a sub team it's a stacked bar chart which means that within the bars the different colors represent the volume of vulnerabilities by priority so critical high medium low and the y-axis is count so it's the number of vulnerabilities open vulnerabilities by sub team in priority okay does anyone notice a pattern and this graph does anyone immediately see something that strikes them as odd team one has an excessive amount of vulnerabilities that's exactly correct so what's going on with that team I think that having a graph like this is really important for two reasons
the first reason which is less important I would say is that it lets your security engineers know who the good and bad teams are it's less important because they anecdotally will already know but this way you can quantify it and put it on a graph I think that's valuable the second reason the more important reason is that you can use a graph like this to drive a conversation forward with that team you can reach out to that team's manager or whoever the relevant stakeholders are for that team and start to figure out what's going on how can we resolve this issue and you'll notice I put in but be careful if you approach the manager of this team and you say
what's going on here why is your team not fixing vulnerabilities what do you like why is your team so stupid I don't know obviously you wouldn't say that in a working but people can be really passive-aggressive or they might have an attitude even if you have the best intentions I think it's very easy for the recipient of this graph to get defensive and to not want to work with you because you're pointing out this problem in their team so but if you instead approach them and say you know what's the root cause here is it a prioritization issue is it a resourcing issue can we provide you with more support are there misaligned incentives maybe
how can we work together to bring these vulnerabilities down or bring these numbers down then that can be really effective and that's exactly what we did with this team we reached out to them we worked pretty closely with them for a quarter and established more open communication channels with some of the leadership on that team and after a reporter we were able to bring those numbers down significantly here's another graph for you the x-axis here is the simply the date the y-axis is count of open vulnerabilities and there's an individual line for every priority of vulnerability so critical blocker major what have you this one's pretty standard if you don't yet have the resources to
invest in building your own custom dashboards and all the tooling around this you can use some of the existing bug bounty dashboards and hacker one you have a dashboard similar to this there might be one in bugcrowd as well so if you can't invest in that you can use the dashboards but I would say it is worth the investment once you can merge in your team data your product component data things like that then you can really start getting the most value out of it the other thing that I like about this graph is that it can be shared really widely and you can be visible with it if you compare to the very first
graph that we saw if you remember that was the one with the vulnerability classes server side request forgery cross-site scripting etc that graph requires some domain knowledge to interpret so it's really intended for the security engineers to see that graph and to be able to glean information from it but a graph like this everyone knows what an open vulnerability is anyone understands this graph so you can put this into presentations you can put it into a security newsletter put it on your wiki put it on a dashboard I think one problem with security teams as many of them are invisible by default and nobody thinks about them until there's a breach and we all know how that goes it's never
a good feeling so by sending out some of this data that you're collecting and being very broad and visible with it by showing people the work that you're doing the value that you're adding the issues that are being resolved as a result of your work that's gonna benefit you a lot in the long term you'll get more executive and leadership support and you're also gonna build more social capital so if you in the future you do want to make a change that's a not non-transparent change that does introduce some sort of friction you're gonna get less pushback from people because you're very broad and visible with your work it's really important to measure improvement over time or lack of
improvement again that'll inform the business decisions that you're making if you're seeing a lack of improvement despite efforts why are those efforts not working or maybe you need to invest more or you can dig in deeper into the data if you are improving then share those wins that's really important so use the data to drive business goals if anyone was here for the first talk this morning about the starting a security program I think it was a similar sentiment there it's very important to be able to use data to like this to drive what you want in the business ok this one the left-hand side is vulnerability sources so you're looking at things like hacker 1 or pen
tests or whatever wherever the report came from the right-hand side our resolution states whether the vulnerability is fixed or not fixed if it's a duplicate if it's won't won't fix invalid whatever and this is data over the last 90 days I just thought it was a really interesting graph you'll see that for this particular data set we had something like 50 percent of our incoming vulnerabilities came in through hacker 1 and then maybe 35 percent came in from automated scanners after that were third and first party penetration tests then employee reports usually come in last although sometimes they can be the most valuable and again you can watch for trends over time so for example if you see an increase from
incoming scanner to closed as invalid you're getting an increase in false positives which you might anecdotally notice anyway but now you can measure that impact you can say we need to tune the scanner it's causing this much extra work for the operations team or maybe we need to replace the scanner entirely or just get rid of it maybe it's not providing the value that we thought it was given the increased workload or as another example maybe you're seeing a decrease in the number of bug bounty reports so that might indicate that you have an unhealthy bug bounty program and you should be investing more time and energy into that maybe the rewards aren't appropriate maybe you're not
responding quickly enough to people so that should be investigated and by the way for building all of these graphs you can use any tool that's appropriate for you but these particular dashboards were built with a tool called super set it's like open source tableau we just connected it to JIRA and made these graphs so speaking of program health you also will have measurements like what is your time to response what is your time to bounty how much bounty are you actually paying out are you on par with what your peers are providing in the hacker one directory this is for Shopify you'll actually get badges for if you respond quickly or if you bounty quickly because
that's super important to researchers and bugcrowd does the same thing you can see it says 75% of submissions were responded to within one day which is really fast that's a screenshot of Netflix's program so probably the two most important metrics that you should be looking at here are response time and time to bounty that's really what researchers care the most about if you talk to security researchers they really don't like being ignored they don't like waiting even it even comes first above bounty amount so sometimes they don't want or need the money or sometimes they are just after the fame of it but having a fast response time probably the number one most important thing it's the least important data for
you to actually collect you'll notice that none of these figures or graphs were actually from our internal dashboard these are public from hacker one and bugcrowd so you get it for free you don't have to worry about collecting it if you want to you can import it into your own systems just so you don't have to look in two different places that's fine but it's also just there available to you and it's also available to the researchers they'll see all the same public data that you do why is this important well there's the obvious reason of you'll have more researchers looking at your program and you'll get better reports as we saw I think 50% of
our reports came in through hacker one so we wouldn't want to jeopardize that by having an unhealthy bug bounty program but there's also some less obvious reasons researchers talk to each other they all are on slack together they'll share reports with each other they communicate about bad program experiences that they've had if they've had a bad experience on your program and they'll share that with other researchers and those other researchers will though will then be less likely to participate on your program as well and same thing for you know bad response time or unfair bounties things like that so by staying on top of these metrics and making sure that they are all healthy it doesn't just ensure that you
have strong healthy reports it also prevents this bad ripple effect from happening that can happen when when you have a slow response time for example and you also get early notifications and access what I mean by that is we've had researchers reach out to us on slack before they even submit the report a researcher will come out and say hey I see something on this web property or I see something on this end point is this expected this looks a little bit weird so we will receive early notification sometimes before the report is even submitted and that's valuable to us and we also even get early access to blog posts when we have very good relationships with that with
those researchers that'll say here's a blog post I want to publish here's the date that I would like to publish it by and we might be able to adjust the late a little bit or even suggest modifications usually around the timeline because we have a better view of the internal timeline of when things were deployed and fixed so we might say you know can you adjust this date to be more accurate and they'll actually take our feedback and do that really valuable to have a good relationship with your security researchers I thought I would talk a little bit about the methodology also that's all great I you know I hope you see the value of why you would want
to run a data-driven program how do you actually do it if you're just launching a program if you don't have a bug bounty program at all start with a pen test and assess yourself don't just launch a bug bounty program I think that will be very hard to get right most likely you will see a large influx of issues and you might not be equipped to handle all of them and it's going to lead to some sour experiences for the researchers so assess yourself first figure out what your weak spots are know them and write them into the program scope when you do launch your program launch it as a private program first make it a limited
scope and have just a small number of researchers make sure that you ramp up slowly so that again you can work out any kinks in the process everything you know it's running smoothly tune your workflow make sure that you are able to triage tickets on time make sure that tickets are getting resolved on time there's any systemic issues that you're seeing maybe it's time to resolve those before doing a full rollout and only go public when you're ready what does it mean to be ready there's a lot of different ways to define this but at a minimum you should have your process down pat like I said everything should run smoothly you should be able to
triage validate assign remediate issues I would suggest having a significant number of researchers in your private program at this point maybe like a few hundred at least you maybe are starting to see a downtick in the number of reported vulnerabilities to your private program that's a good indication that you might be ready to launch assuming that you don't have an unhealthy program and you should also be ready to launch ready to handle the influx of issues anytime you go public and especially if you start paying out for vulnerabilities you're gonna see a large group of people immediately target your application and they're gonna find things just because not enough people have been looking before so you need to be ready to handle
that and regardless of whether you're starting or have already started a program as I mentioned before you've got to define that taxonomy you've got a specifically I think these are the most important things tag the vulnerability class tag the source of the vulnerability tag of a team that it belongs to and keep track of SLA I think just those you know four or five things will get you really really far in terms of what value you get out of this data so in conclusion data-driven bug bounty super valuable it informs your security posture its input into your security roadmap it helps you drive conversations forward with other teams it lets you be visible in your organization and it
helps you have a healthier bug bounty program and in terms of methodology I would just say start small and scale out it's better to go too slow than too fast so with that I think there's a few minutes for questions and I will also be answering questions on pure list yes so the question was is there value in doing this sort of data collection and bug bounty if the primary if it's a run-of-the-mill Walmarts of the world more corporate II Walmart is getting pretty advanced Walmart has some pretty large stuff they're making a lot of acquisitions I think in my ideal world everyone would have a bug bounty program I think it's very valuable but
it's mainly a resourcing issue especially for a lot of SM bees like they don't even know how to set up a router there's no way they can do anything like this so I think that managed services are probably the answer there some of these managed services or provide services to the smaller businesses and those providers are the ones who need to run by granting programs if that makes sense yeah can you speak up have I thought the question is have I thought about posting the taxonomy that I used it's pretty much so the vulnerability classes that you saw there that was pretty much it I don't know that there's much else the teams are obviously going to be internal
every company has a different team the sources are probably going to be mostly identical for every company your bug bounty you've got scanners and you might break it out to be more granular than that but I think the ones that you saw on the slide are pretty representative with the one thing I would really like to fix is the security miss configuration like I mentioned it's quite broad right now so
my internal what I see so the question was on this one slide on this slide employee reports comprises a very small portion of the overall number of reports and can I speak to that I think it would be great if more employees reported something usually they're the ones with the most information they're really the boots on the ground and they can hear and see everything it all comes down to a largely security culture I think and sort of evangelizing that security culture and providing people more again visibility I think if you just share here's all the stuff we're working on here's how security is important to the business and sometimes people will start to volunteer come out of the woods and
say hey did you know about this issue or hey did you know that you know this service is accessible from the internet or you know what have you it would be great if we got more reports I think in practice it is probably relatively small for most companies I think you know bug bounties and scanners are going to always comprise the majority unfortunately that's it for questions for now let's thank our speaker again thank you
Related talks
 24:32
24:32 24:20
24:20 20:30
20:30 28:29
28:29 29:24
29:24 32:13
32:13