GF - Applied Quantitative Risk Analysis - Michael Rich
Show transcript [en]
all right I don't typically put my search on my slides but in this case I want to put a CP up there for a particular reason and that reason basically is that when you go to events like this I think it's really important to seek beyond what you typically go to have to know the CP I mean I love popping boxes I love red teaming you know it's super exciting then I went to this talk at besides Los Angeles and kind of got a feel for for this book and it's all about what we're gonna talk about today and it was interesting to me you know okay so if poppin boxes is like up here quantitative risk is it's not
there right it's not it's not poppin boxes in this microphone but you're really gonna kill me isn't it it's not poppin boxes you know I don't do a jubilation dance when i when i quantify that risk but it's very interesting to me so I just want to encourage everyone to reach beyond their normal knowledge when they go to these conferences don't go to the same things all the time and that's basically that so this is the book it's all about Monte Carlo and quantitative risk analysis does anyone here read this book besides me I got a couple a few alright does anyone here know anything about Monte Carlo analysis the same people that read the book and a
few more okay I just want to judge how much of the basics I should go through and I'm gonna go through them pretty close then okay so we're gonna go through that then I go through what I learned as I start of applying this at my actual job but I work out right now and in kind of the issues I ran across and so Hubbard's book is great it's fantastic it comes with a free set of tools you can download it's got a it's got Excel spreadsheets you can work on I found I couldn't ask questions and that spreadsheet fast enough so I wrote the whole thing in Python and that's all available online on my repo which will
be at the end of the talk you'll see it so you see all my tools are available including the diversity Commons just the spreadsheet you're gonna see and and my sample risk that I'm going to show you these the whole model that I used so if you need to get into this stuff the book is a great place to start and you need to start there and then use his tools and then I think you want to move on to another set of tools very quickly and I'll talk about my application of what I really did at my current job and my results of my first risk I'd modeled like just two weeks ago and then I'll go
into what I'm doing next okay so the idea we all know a risk to our risk to our event that has a possible possibility of happening and it has an outcome we don't want right on a qualitative risk analysis we use the seed map right we go hey we're gonna we're gonna subjectively qualitatively assess the risk as far as how often it's going to happen and how how high the impact is and we plot it on a chart quantitative risk is the same it's a subjective subjective assessment of the risk both the probability and the impact and you and you model at any problem on a chart there's really no mental difference between how you do it
I'm gonna go through this chart you're seeing right here in detail but it's the same thing the biggest complaint I hear when I start talking to people about quantitative risk is the numbers aren't there it needs to be exact it has to be based on data we don't know the data for breeches none of those things are true when it comes to modeling risk with Monte Carlo and quantitative risk analysis it is subjective and you the difference is instead of just picking a number letter a category like high or very low we we stake a claim we assess the risk based on a measurable observable scale and we're gonna go over how you do that and
it's it's it's absolutely possible and absolutely can't be done and the best part is is it when the data changes you can remodel very quickly and you can easily compare your risk because they're on the same scale so if you get risks from source a and you get risk from source B this has happened to me I'm sure it's happened all you guys if they're on the same basis you can combine them when there are two separate heat maps with these linguistic terms you can't combine them you really don't know you don't know how many of those risks in the green add up to a risk in the yellow there's no way to know that
but with the qualitative risk done properly and on a proper scale you can and that's why I really like quantitative risk stuff as an engineer super appeals to me okay a quantitative risk first you star the probability of occurrence instead of saying it's likely or only a little me you're never gonna happen you have to pick a number you have to sign a probability and this is tricky and difficult and we're gonna talk about the impact it has on your on your your models later but you do have to pick it and you can express a range for uncertainty you can say there's a 12% chance or there's a nine to 14 percent chance or any other kind of
distribution for possibility you want to use you can use it all right and then the loss huh talks about loss almost solely in the terms of lognormal this is a standard distribution for real-life activities and processes that exist in the world and I'll show you a graph of that in a second and basically you have to pick two numbers the lower bound on the upper bound the upper bound is you're saying hey 95% of all all events will have this impact or less and well I'm gonna show an example it does in a second and then the lower bound you pick hey 95% of all occurrences of this event have this impact or more you pick those two
numbers you use the log normal distribution and you get a very close to real-life distribution of what kind of impact you can expect and the interesting thing about log normal is this great tale out here a little thing is my finger this great tail out here shows a you know low probability but high impact events and we call those you know your black swans right log normal captures that for you and it's it's super useful now do blog normals exist in real life this is a graph from a black line black line is a financial services company that exists in the valley where I live I don't work for them but this is on their
website and this is it's it's saying abre days for assignment completion and you can see it matches the log normal distribution most of them are clustered around this four day mark you've got some that happened very quickly and you have other ones like when your paycheck gets released happened you know 20 days later right so so it kind of shows the Black Swan effect and it shows the log normal so that's just to kind of show you the log normal is a real thing and there's lots of like real-life processes that mimic this distribution and that's why we use it for our quantitative risk assessment okay picking the numbers how do you pick your numbers for that lower
end and upper bound for things you don't understand and don't really know like the impact of a breach right very difficult to pick those numbers one thing I didn't cover real quick is I'm gonna do all of our breach effects in cost I use almost nothing but dollars because you know that's what businesses work on however in a previous life I worked for a defense contractor and I was working on the air for an Air Force weapon system and I attempted to start tying cyber breaches to the to the root mean squared error that that weapon system may expect with cyber breach the point was it's a measurable observable effect that you can estimate based off of every one
estimate it and you can use it so it doesn't need to be dollars if you work in a world that doesn't require dollars then you don't need to but it needs a measurable observable and a proper ratio scale a real number scale you can't just have a made-up number scale for you to make it work okay so back to this so how do you estimate your numbers so Humbert goes into this in detail it's called calibration of the experts and it turns out there's plenty of research that shows you can take a person you can expose them to things they don't know anything about lots of things I don't know anything about you can learn how to
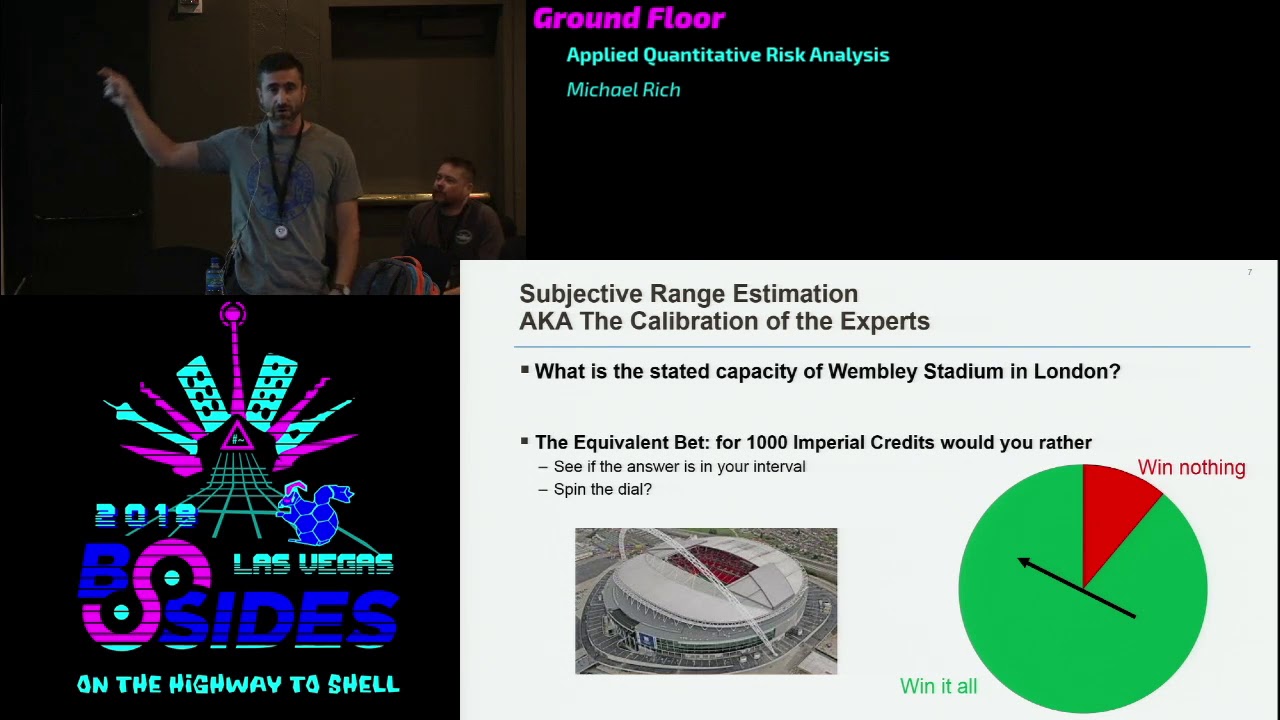
estimate the lower bounds and upper bounds in a way that you are right 90% of the time that the real answer is in between it's a called calibration his uh his website has a for calibration test you can take I've taken one and I came out 70 percent of confident which means I'm actually overconfident which means the numbers that was right was uh was I was was out of the bet out of the bounds I picked too many times all right you want to be uh you want to be ninety percent confidence means I need bigger ranges bigger lower and upper bounds so and it works like this you get a question on something you have no
experience with what is the state of capacity Wembley Stadium in London and you start thinking about it okay we can go up serve we can go the lower bound is is at least one right at least one person can fit in Wembley Stadium right the upper bound a million you know there's no way more than a million people fit in Wembley Stadium and live right okay so so we have this giant range but now we're going to think about bringing that range together because us too much uncertainty right doesn't it's not useful information so then you say okay I don't know ten thousand the minimum is ten thousand at least ten thousand people fit in Wembley Stadium
and maybe the upper bounds five hundred thousand okay you start getting to a smaller range and you hope that the answer is right in there somewhere and the point is you do what he calls an equivalent bet all right it doesn't even matter if it's real money or not you say okay for a thousand Imperial credits would you rather spin that dial and land on the green or see if your answer is right that your answer that your range includes the actual value and the point is you keep reducing the size of your range and till you don't know if you want to spin the dial or you want to find out if you were right so we can play with that we
can say okay we said 10,000 is the lowest and 500,000 the highest I know that the answers in there right I mean I don't think any stadiums 500,000 people all right so I can bring it in 50,000 to 250 what I want to do what he does if you want to spin the dial or do you want to get it see if your answers right what's what's the crowd what do you guys think crowds dead nobody cares what's right 200,000 okay so he's playing the game with me he's saying okay we're get the 200,000 and we're 50,000 now do you think the dial is right or do we think we can that our range includes the
answer we keep doing that in our head over and over and over again until we get to a point where we can't choose between the dial alright in this case the cassie's 90,000 stated on their website and and you do that for all these things so if you take Hubbard's calibration tests there are a ton of questions there you have absolutely no possible idea of knowing and you have to get used to the fact that when you're faced with something like that you put very big ranges in place and that's the point of risk measurement and measurement as a whole is the reduction of uncertainty so if you don't like your ranges you come up with you have to come
up with the test or a measurement that'll help you reduce them it's really simple as that okay so you can do this and you can start getting some pretty accurate ranges alright so here's a qualitative risk example I live in Los Angeles if traffic is occurs where my morning commute I will be delayed probability one two three days I see a wreck it's simple as that the impact between five and 60 minutes I'm saying ninety-five percent of impact of wrecks are in a Dulaney by an hour or less or five minutes or more right right that's what I'm saying in that range right there some of you much longer some would be shorter but 90% of them are gonna end up
right there Monte Carlo is you take that you take that probability of occurrence and you take those ranges in a log normal distribution and you start plotting the the occurrence values and how how many you generate so this is a snapshot from Hubbert spreadsheet you put the probability of occurrence you're a lower bound and upper bound a number of trials you want to do and you go through it so trial one what you do is you take a random number from from 0 to 1 0 to 100 whatever you say if it's less than your probability then it occurred trial 1 it didn't happen okay trial - I got blow 30 and my delay was 14 minutes so on and so forth
you see a 50 minute there one and you get all those so question I came by I want to know how many iterations are enough because Hubbard spreadsheets actually limited to like 10,000 because of the way he does it in the Excel spreadsheet and I like is that enough I don't know so of course I broke my Python code and I did a test so you can see with 100 iterations you can get a general idea of the shape with a thousand iterations you get a better shape and then between ten thousand to a million iterations there's not a lot of change in that in that curve right those are those curves I'm gonna feel like I'm
attached to a core but I'm not I got used to that these curves here this is a 10,000 and then the 100,000 and a million right on top of each other now this isn't a lot of computing power I do this on this laptop and that takes I don't know 20 seconds to run so it doesn't take that long to get a million iterations right and then when you have multiple risk it takes a little bit longer we get into the detail risk decomposition stuff that I'm gonna show you in a little bit to take a little bit longer because I'm running a lot of log normals but the bottom line is you can run these on a laptop easily you don't
need big computing power now also this greatly the probability event greatly impacts how many runs you need to do so if you're talking an event that has like a tenth of a percent of a chance of running you need to run a million events or more in order to get a smooth curve but it's obvious in the data so when you print it out you'll get this the stair step stuff you get these stair steps and you'll know I need to run more more more rounds as simple as that so you turn up turn up a little bit but in general between hundred thousand one hundred thousand is good enough to get you a good feel for your going so it doesn't
take that long that's Monte Carlo simulation any questions on that first the only a few people here that studied it before okay all right it generates what's a lost exceedance curve elastic season's curve it demonstrates how much you can if effect I'm sorry you can expect your impact to be what you do is you take your min value and your max value so min value is one max value somewhere out here this is a log-log trout so it's somewhere like 250 or so know if that's over 300 isn't it and and you you do an equal number of intervals and you calculate the number of events that equal the impact or greater it's always a little greater so
at the one here so one minute or greater 30 percent chance and you keep going down the path and you'll see where you get to so we're saying I have a 30% chance any given day this is my traffic one 30% chance any given day being a minute or late or worse late for work let's say I'm not doing so good with my boss right I need to I need to make sure I get there on time I need to lower that to 5% you can use the loss of seasons curve to find that out so 5% go over and down you're talking need to leave somewhere around 35 minutes early 36 minutes early in order to make sure that
you are on time at work all but 90 all but 5% of the time all right that's how you use the loss exceedance curves and this is what the wrist generates every time all right okay now let's go for practicalities that's kind of a theory and then we start trying to think about how we want to use it you start running in some problems very quickly the first one was curves are pretty buddy to rank them right if I have if I have curves like all over the place on there and they all intersect each other which one's my greatest risk I don't know but certainly my boss wants to so you reduced the the curve to a
single number and that can be done by calculating the area into the curve this is exactly how they catastrophe insurance industry does this they when they have stuff like earthquakes and hurricanes things that they don't really have you know actual knowledge what's gonna happen or good actuary tables they draw these up in a calculate the area under the curve and that's your premium that's what they charge you in general right I'm simplifying for all intensive purposes they arrogant of the curve is the mean of all of your data all your results I did I have a thing with like it's five like five risks and I check the difference between the means and the and the area under the curve and was off
by like three thousand seven percent so really for all intensive purposes just calculate the mean of your event that's all you need to do and besides the area of the curve is approximated anyway because you can't just you have to calculate with an approximation so so from I commute on average I'm on only seven minutes late according to this math right which is exactly why I ride a motorcycle every day so I'm not seven minutes late and then but but you have to watch out for the black swans 240 one minute max impact so how do you want to rate your wrist to an irate on the max impact that has less than uh this is a either a
hundred thousand or ten thousand scenario run the max impact was two hundred and forty-one that's a that's a one in 10,000 or 100,000 chance of happening right having lived in LA when the suppo for the past caught on fire it happens it took me four hours to get to work if I couldn't even go to work the day I turned on went home I'm like I'm not know the hell with you I'm not doing it so so you have to watch out for that so you need to choose how you want to rank your risk is probably not reasonable to use the max impact because it's such a small chance of occurring but maybe that's what really concerns
you so there's that and then I started having a lot of questions about Monte Carlo about how do I use it there's three independent variables and I'm using I've got probability of occurrence I have upper bound I have lower bound right which one's affect my outcome the most I've got concerned about this I mainly got concerned about it because because it's really hard to pick a probability for your events right and we're gonna go over that how I did it but it's very very difficult to pick a probability and so I was hoping that probability maybe wasn't that that sensitive for Monte Carlo and I could get away with it so I went over it did
models probability lower bound and upper bound and turns out Monte Carlo is a precious snowflake so for probability you can see I losing my audio and I can you hear me I'm good okay probability you can see thirty thousand if I modified the probability by thirty thousand percent the result modifies a thirty thousand percent so it's almost one-to-one so it's really important to not get that wrong or to take that error into account you can see lower bound home was no impact no impact on the actual results that come out of the model an upper bound has some impact but probability man okay and then it was even worse than I thought so these are order of magnitude bars so
like between one and three percent you can see it you know there's a change two hundred percent and the result changed two hundred percent it's almost one-to-one so not only is order of magnitude a problem but within that water magnitude I can I can make this this risk live or die as an important risk just by picking the probability incorrectly and so that was a little interesting and you can see it right here in the in the graph like I told you the result the average and expected loss is the area under the curve so when you changed the probabilities you get these big differences in the curves and so of course the area underneath them is a is
the big change so that got me really concerned I was like okay well I'll handle that I'm gonna do I'm gonna take care of this problem this snowflake I'm gonna add her to my probability bars right so instead of a 1% probability let's make it a half to one and a half percent that's at 50 percent error bar so great that should do it turns out it has almost no impact because over the course of a hundred thousand events everything reduces to the mean probability so I stated it at 1% I moved it them up and down honey badger don't care it's gonna do the math right so I got to this point I was like
okay so I kept playing with it here's some bigger ones now I have a huge error bar at 5% verse with a plus or minus 4 percent that's an enormous error bar and then I put these other probabilities in there we're going to talk about beta in a second and then 5% fix is just a 5% flat you can see the differences are not that big so once again because I said 5% I'm picking my my results and I did some more here's overlapping error bars 4% and 5% and you can clearly see when I speak 4% or 5% like the math just goes right to it the LHC don't lie so that really got me really frustrated I'm like
what am I gonna do and then I decided I am probably lost in the forest here I'm not seeing the trees I've not seen the forest - cuz of the trees and so I came to the conclusion that yeah this is a big deal I need to be really careful about it but if but the point of this is not to compare small variations of one risk to each other is to compare multiple risks across my company and identify the ones that have the most impact at least impact if I get to the point where an order of magnitude change of my probability is how I'm switching my risks I think it's actually a win now
I know which ones I need to focus on and then I also need to say hey ok yeah they're flipping back and forth but maybe the risks or the loss is associated with that are not even physically relevant maybe they matter to my company's bottom line maybe they're just accepted maybe our insurance covers it and then you also can get the qualitative differences at this point I've now identified things I need to be interested in the quality of the loss and what about me up mean by that you're going to see a lot of this in a second is how do I decompose my risk some losses are cost of opportunity so your security engineers are there they're
working hard we have a breach whatever they are doing before the breach they are no longer doing they are only doing the breach right that's a loss that's a that's a lost opportunity and then there's actual cost there's HIPPA fines there's things like that that actually cost the money the company money which one does a CEO care about more that's up to your CEO but you need that helps you figure it out so I still consider it a win even though we get to this really delicate position with probability all right since property is so important I found myself considering like how do I think about probability how do I cage my thoughts about it so I started looking
up like life events statistically equivalent probabilities so at the hundred fifty percent chance of an event happening I don't call that a risk that's just something you need to plan for that's a cost of doing business because if you take that out so say you do six month windows and you do aggregate risk across multiple six month windows fifty percent probability there's almost no chance you're not going to see it in the next year all right and you can check the math on that so we're not gonna talk about those but let's talk about 50 to 10% probabilities I call these my weather probabilities and and they're still really big but they make a difference in your thought
processes for instance since I ride a motorcycle most days I checked the weather every day in the winter not in the summertime when it's 110 and there's no clouds but in the summer in the winter time I check it if the probability of rain goes over 20% I won't ride that that's my risk level if it's 10% I will so the point is there's a distinct feeling intellectual difference between 20% risk and 10% risk and you guys need in cope bring that in and then you need to think hey someone says this cyber risk is a 15% chance of happening you're talking like pitching with some chance of rain you know the rain happens right so you're basically B
to be prepared for that risk to occur at that level 10% chance that the next person you meet having a left hand being left-handed I mean we all have left hands 1% chance of that almost being left-handed how many left here lefties do I have in here we're well under 10% but anyhow that that's a that's a statistical life equivalent probability so is this probability of a cyber thing happening more or less likely than a person with a left hand Oh a person being left-handed all right three percent chance that the next guy you meet does Doga regularly do I have any men Yogi's in here there's one two yeah that's about right for this room
all right so you need to think someone said that we're gonna get breached on this website is that more or less likely than the next guy that I meet does yoga regularly all right that's the way to think about it 1.5 percent chance of having twins so I know about you but but twins are are fairly uh fairly likely I mean you know about them but I let me reset I had a reset I want to fast okay I don't know anybody who has twins personally but I know a lot of companies that haven't breached so if someone tells you that the chance of a breach is under 1.5 percent you might want to be
skeptical because there's so many companies that are breached 1% chance of getting 6 winning hands and blackjack in a row if we all play blackjack last night hopefully 1% of us had faced that what did you happen to you six hands no oh okay okay yeah you know these odds yeah all right so one percent chance of that happening point eight percent chance of being audited you know I don't person Oh anyone who's been audited by the IRS but I know lots of companies have been breached so if you start seeing numbers like this you got to be skeptical then finally 0.02 percent chance of getting a perfect score on the SAT life equivalent probability is just a way to
think about things when you're faced with picking a probability for your events or you look at that on that result it gives you a number which I'll show you how I do in a minute there's there's that okay so instead of just guessing and making up numbers you can also use a thing called a beta distribution to come up with your probability distributions and this is actually how I'm doing it if you have a set of cases that are relevant to your task at hand your risk at hand you can decide you can come up with a probability distribution by counting a number of cases that count against you in number cases that don't I do this on a date basis and I'll show
you how I do it but basically looks like this the band distribution like here says I have no information none at all about what's going to happen so any chance between zero and 100 percent chance is likely for this event but then I get maybe I know 20 companies and one of them got breached so now I have I've one hit out of 20 and I get a little bump at the 5% mark right but when the beta distribution delivers our probability it'll still pick along this line you're just gonna have a much higher chance in the 5% mark and you can eat keep adding data so as you meet more companies you mean more people more
relevant cases you can keep adding to it until you get a very high probability spike at the 5% mark assuming that's the way it goes right so you can this is a great way to keep your data fresh on your models fresh and and it's discussed in detail in Harper's book all right that's kind of the theory of all this stuff now I tell you how I did it okay first I need to introduce you to my company this is motion picture industries any else anyone else work a Taft Hartley multi-employer plan here no I didn't think so so what these are consider them continuity benefit plans so in the entertainment industry there's all these people that work and
they go from Sony they go to Paramount they go to Disney when they move their contributions come to us and they maintain their benefits as they move across jobs it was put in place for four craftsmen there's many of these in LA there's we handle you know I'll show you so we don't handle stars that's like Screen Actors Guild basically there's a director scale to product producers guild we handle everyone behind the camera all right so we're the largest one of the largest have hardly multiple employers in the company in the country we get a lot of attention because of that you can see then what we have here we have 48,000 participants 18,000 retirees but county dependents of
130,000 people that are subject to our health care plan and we process you know almost 2 million claims a year healthcare claims as we do so our health care company right so that's the basis of my thought process so one of my risks obviously on my HIPAA shop so I have to deal with that so you know I've been subject to audits and compliance checks and consultants come and they give me a list of stuff so I'll trying to come up and make you think they call them risks but I go through them and they don't meet my definition of a risk they are factors that contribute to risk and I'll give you an example so so we got hit
four because uh someone saw someone moving PII to a cloud-based you know application right so it was authorized was fine but they that was something they saw hey you're doing that that's not a risk one because it happened so that that makes it an event and two it really just contributes to magnitude of loss I can expect so working a thought experiment with me whit's design a fake computer system that is fully aircraft air gapped it only can transfer data through three-and-a-half inch disks right that's it one point four four megabytes of disk there's probably ten of those in the entire world right and probably eight of them are at Def Con right now so that says computer system versus my
real computer system which has internet connection to PII unfortunately the my exposure is much higher so it's not a risk the PII the the fact I used I use the cloud thing isn't a risk but it contributes to the magnitude of my exposure so I include it in my risk calculations but it's not a risk on its own so then I thought about hey what's let me look at all the applications all the in-house applications we use or the external applications we use in fact this is what Hubbard recommends as your best practice but I have done full audits on all my applications and I know which ones comply with HIPAA Security Rule and I've
already stated that audits don't don't result in risks they're voting result in factors that contribute to risks that includes my own data my own audits so and they all basically touch the same data on the back end anyway so so I decided that it wasn't doing an application basis that mattered and said I decided to go with the CIA tree ad against my data itself the data pools and this is my one the exact one I'm gonna model for you right now so I said in the next six months you got to pick your time band risks are time banded and I picked six months you can pick a year you can pick a day whatever you want
just make sure your numbers work there's an X percent chance of medical claims data confidentiality breach of 500 records or more 500 records is the trigger point for Health and Human Services ego over 500 records that's when the pain comes so that's when I wanted to activate most of my app my cost centers so that's why I picked 500 or more and the impact did that breach will be Y dollars all right so that's a nice statement of a risk but now I got to get down to business how do I calculate these risks okay starting with the why the risk decomposition because the costs are easier than probability so what's to start with that
one basically I started with my cost centers watching the security process that I run I was like okay I know when something happens my engineers do this and it takes him this long and then I started thinking about okay if I had a big big loss of data probably multiple business units across my company would probably get involved in this so I wanted to estimate that so first I did that I broke it down to these cost centers based off of the the actual Department and I estimate the lower bound upper bound then hours of time I think it'll take to handle the risk and then the lower bound upper bound of cost per hour all right this is just how I
went about doing it the cost I use they're rough they're not they don't match our salaries I can't HR would kill me if I put our real salaries on here so I'm not doing that but and I just estimate the hours basically the same for security I'm saying hey a small breach small problem my engineers will fix in about five hours a big one two weeks I can't see a full time for anything longer than four weeks of full-on time fixing a breach in my opinion it might be wrong but that's what I picked and then the salaries I know how many people are in those particular divisions and so I can cap the salary cost per hour I did that for
every department in my company and then it moved on to what I call my real costs these are things that we'd have to like end up doing right so if we if our codes showing bad we're going to recode it and we tend to use contractors for that so that's gonna cost us real money we have an incident response retainer that I'll have to burn our legal consultants or ridiculously expensive so I got to account for them and they're armed retainer well any being a new tech control right I mean everyone who's ever been through a breach knows you end up buying a new tech control so so we put that in there so I call these my real
call centers and and so I kind of went through this and I decided okay this is how I breaking down my wrists and my costs each one of these ends up being a log normal distribution you can sense why I use upper bounds and lower bounds and a cap and it does the math and I decided hey I need to compare this to people who have really looked at the cost of breeches so you know you know Pony Monson's lots and lots of people have done this discovered that the cost centers I picked are actually really close to the cost centers that they bring up and they're in their reports and so although the costs are unique to company I don't
think the cost centers are that unique and as anyone else here subject to technology business management from the CIO anybody nobody really okay I'm not gonna talking about that but they have defined cost centers in that project as well and they match up to the pony mount call centers the point is picking the costs for an impact of an event that affects your IT department or come country doesn't need to be black magic it's it doesn't it's kind of define for you you just need to dig in and assign your numbers that you think make sense for your company so that you can get to a good risk decomposition that way and Hubbard goes through all this in his
book as well about how decomposing the risks and I I don't have to do this right I could just say hey I think it's 10k to five million claims breach a five hundred records or more 10k to five million I can just make that assessment but I don't know if I have a real basis for that assessment so I wanted to break it down and I used the log normal distributions for everything except for HIPAA fine data this is a statement for what a HIPAA fine can be right it's pretty big hundreds of 50k per year max penalty of 1.5 okay but you can find HIPAA fines and exceed five million you can find HIPAA fines are a lot higher so
how do they so let's this max penalty thing I was like you know what instead of guessing I'm gonna try and model them on real data so we're looking for real data the Health and Human Services website has lots of information on current investigations but almost no information on charged fines but this website here does this compliancy group they have about two years of data there's 26 samples in there I was like alright I'm taking this as my model I put it together and I was like okay I'm gonna make that as my I'm gonna call it a standard distribution you know like the bell curve but the numbers didn't make sense the the mean and the standard
deviation didn't work so I plugged the data and that is not a standard distribution it just isn't alright so I'll say okay now what do I do I might be able to guess that distribution is I might be able to make something up but I did some googling and ended up on this site here the Stack Overflow and this guy is they may or may not be to me these nap down before you know it's hard to know he wrote this code that'll take your data and run every distribution and CyHi against it and come up with the one that fits best and then give you the parameters so you can use that distribution in your code
it was amazing I loved it I've generalized it a little bit and I made it so you can use other things besides what he did and it's called model fit that pie it's in my district it's in my repo you can uh you can use it I mean generate the fit for you this is what it did for the HIPAA data I don't know what I'm looking at okay that's like basically a blank graph thank you but it gave me those numbers up top the the setting is to make the power law work and it says hey it's a power law data data system that's interesting it's a little dangerous because power law can get really really big every now
and then but I was like okay well here's I'll do I will take a twenty six samples out of this new random distribution and I'm pod and next to my actual data and we'll see what it looks like so here's the original data that's what it looks like when you plot it here's my model I'm like alright okay I mean the you know is it Gordon I guess name wrong George box someone says sorry last names box I'm pretty sure I said that uh all models are wrong but some are useful I think that's a useful model so I use this to to model my HIPAA fines for all my events now alright so I got my I got
my costs now let's talk probability so we talked about this already that I had to be careful about this it like I said I can make my my risk live or die based off of this number that I pick for this event right here and that frightens me that's a lot of pressure to get right and I started thinking about it and I was okay the absolute value of my risk probabilities probably matters less than the consistency in the way I picked them if I'm consistent across all my risks then my risk to be compared against each other so I'm just yanking stuff out of the air every time then I'm probably not gonna be consistent I can't compare my
risks equally so I decided to go with beta distribution basically I'm saying you pick a time window I said six months you pick your you have your data you associated with dates you can see these red marks here this is a sample fake data you can say okay I had a breach in January of reach in March and a breach in November and then I moved that six month six month window okay this is a hit this is a miss or this is a hit because I've got that one in March in there this is also hits on up to three hits and now I get to April and I have a window where I didn't have
a breach so now I've got three hits and one miss same here with May and eventually you do this through all your data I did it through my my breach data and I had one hit in twenty and twenty misses I use that in my beta distribution as I show right there and and I that's the way I pick my probability based off of MPI is the actual history now we actually haven't had a breach at that with that magnitude but when you start from a zero knowledge baseline like I said that means you start with one hit and one miss and then you have to add your new data on top of it so you always have one hit it's just
the kind of way it works so I wrote a piece of code for that you can give it the time window you want you can give it the sliding time window you give it your dates of events that meet your criteria and you know calculate your beta parameters for you it's right there in my my repo and it's not exactly perfect I'll be honest there's some weird edge cases it doesn't handle all right but it's close okay so I got to the point now where I am I'm writing the code so I coded it up first I do my my my cost of opportunities these are my manpower costs then I do my these are my real
costs you can see what I did there I put it all in a simple model and then I ran it and all this code is available I put the whole claims risk thing in there it's I think it's claims or stop hi it's in the repo so you can see exactly how I use use my own models and how you incorporate them and this is the result okay any questions all right no all right so so busy I'm staying on 5% chance of a $10,000 loss or more in the next six months okay and then you can get down there and like you know the million dollar mark a matter like a three percent chance at the 1% chance I
get down to some you know pretty big numbers especially for my company like two and a half million now is this good or bad that's up for the CEO to decide and you have to go through them go with them and have a conversation about risk appetite you go hey do two percent chance of a three million dollar loss you happy with that or not and they have to decide that their job they have to decide what they can the business absorb that kind of loss or not and you can plot their results on top of this and see where you need to pose mitigations on top of that I haven't gotten to that point yet
I'm just the CIO is happening with this I happened on the CEO yet and one thing I didn't cover sorry on the probability so the beta distribution has given me my baseline probability but what about new factors what if I say hey I'm exposing a new public API in the next six months I'm bringing a new code contractor with a with an uncertain history all these things affect the probability of my my breach occurrence and there's a whole section of Hubbard's book about doing a mathematically consistent way using Bayes theories to include that data in your math I didn't get there yet but I am heading in that direction so I encourage you to read that section he
has a spreadsheet you can download to incorporate different pieces of information you'll notice it doesn't look like this this is what my original risks I showed you look like they have that nice little fancy tail that's because I capped all of my losses I chose to do that if I turn those caps off I will get this the S tail and you'll get the big black swuan you need to decide whether you want to do that or not but bottom line this is what we ended up with and and it's kind of the set up we're gonna move forward with so where am I going from here and I'm I'm short on time but I'm not sure on time
moving too quick for me I need to do the integrity and availability of the same data and this requires a fairly you know in-depth interview with the business product business units like like hey if the integrity of your data is messed up what if the actual impact of the business the availability is messed up what's the impact like I've discovered that if my claims data is not available for two weeks then we end up paying a hundred percent of claims not 90 percent that's a substantial monetary impact so I have to look into that a little bit more and model it so I need to do that for my claims data I needed to get into
the considering other factors on the probability that's important I need the model and other data stores I've also got as a eligibility data I have retirement data I've lots of other information I need to look through and then the big thing in do I need to carry my manpower versus actual cost through like if I showed you this slide here I don't know the makeup of this when I talked about the qualitative review of is this is this mostly real cost there's a mostly cause of opportunity I don't know because my model doesn't carry that through I can't tell if I need to kind of add some hooks in there so I can see that data I have
more ranks to do or more risk to do and then I'll talk about mitigating them and I need to formalize the process if I'm gonna get this through a HIPAA compliance review this has to be formalized and documented and all the fantastic things that make life so fun so I got you that for you guys I recommend going to get Hubbard's book it's on Amazon go get my code there's the repo right there I'll leave it up there for a second and then think about how you want you can pose your risks how you want to calibrate your team and then do the models and simulations I think it's really worthwhile yeah I think it's
really worthwhile I like this method way more than the heat maps the standard NIST Man Man ways of doing this risk I can add new data I can compare new risks I can I can I can do everything I need to do to make this work for me and my company stuff I was never able to do with your basic heat map risk work and that's kind of where I'm at so I'm a little early um I'm open for questions yes sorry for the mic I'm so sorry I got here late but did you cover reputational risk or attempting to quantify the the softer costs or can if you think that's relevant to your company so Hubbard has
a whole section on that okay is there any company that's not relevant for he will show me that the math shows the reputation isn't affecting bottom line on companies in the long term like I've heard that like beyond six months like on stock prices like coverage even in the book he talks about target the target loss and the the the dip and target was indistinguishable from stock noise within months thank you so where's that yeah we went up here
I had a question on residual risk yeah and being able to track after the mitigation of whatever action has taken place to reduce it and how you're tracking a risk past the initial point of identification right so you're saying you identify risk we get the CEOs curve and we don't and we're too high so we need to we need to reduce some risk on that you have a series of risks that you put together that help identify things again you were kind of mentioning this whole idea that you know the probability of this one thing you can kind of get into the minutiae of how do I rate that but it's really valuable on the meta
scale of all these risk put together however after you go through that and maybe you change that environments situation that attack surface and now you reduce a specific risk within that how are you tracking the residual risk in terms of kind of applying this so risk is not a it's a point in time yes and so kind of how do you how do you continue to model that through so the only thing you can do it so if you're gonna do a mitigation and easy either reduce the impact or the probability of the event by definition right and so you have to make an assessment if you're gonna buy a new blinkie box you know
you're saying my blinky boxes and reduce my risk because I'm gonna cut out 17 more attack vectors you know so probability goes down something I haven't gone into yet that I'm planning on is I'm also a miter attack matrix kind of guy so I want to show hey currently I'm not grading I'm not detecting these things but now if I buy this blinky box I'm gonna have these more things I'm gonna be be able to see and it's in stop and so I'm planning on attempting to use a beta distribution to show how that reduces the percentage of probability but I'm not there yet so but bottom line is we lots of times get offered solutions and services that
don't reduce probability or impact and they're really quite worthless from a risk perspective and so you have to take that into account and making a an assessment you need to estimate what you think the rest production will be if you're not convinced as a risk reduction then don't buy it yes so uh from your modeling it it looked like the probability was one of the biggest effect of all this calculation is there any sort of movement to standardize the probabilities of of incidents that you know across industries I can basically say no right I mean nobody wants to share their data right so it's it you have to base it off of your particular industry like like I can look at health
care companies and say how these companies got breached are they relevant to me do I do I focus on taft-hartley multi employers do I focus on the entertainment industry Taft are the Emotiv employers let me like six of them that's not gonna be very good data and so so the answer is kind of no right you kind of have to gray the data how you want and and even though there's a lot of like there's ice axe and there's cyberhood watch with the FBI still the sharing of data on actual breach and how things are breached its really really sparse so that would be super useful and people talk about hate the cyber insurers have good actuarial data but I
don't think that's been proven to be true either so there's a lot to think about on that perspective from industry perspective yes so there's a lot of talk about velocity associated with risk assessment yeah how fast is you're gonna realize that probability is that factored into your model at all or talked about any in the book not no I didn't I haven't gone there with that right so I think you have to talk velocity if you don't talk about time windows so you're like you know you're like hey I'm setting this to my six-month time window and you're like this is my risk for that window if factors changed then the product of risk changes but he doesn't discuss velocity
in his book near questions yep oh god oh god so you modeled a lot of this stuff at least in your examples on your personal life um how much earlier do you leave for work now because I ride a motorcycle I don't that's the great thing about LA traffic is I I do the white line exploiting through the LA firewalls every day so it basically takes me 35 minutes no matter what's going around except for a complete closure of the freeway anyone else all right thank you guys very much [Applause]
Related talks
 51:51
51:51 32:48
32:48 33:48
33:48 54:33
54:33 31:06
31:06 20:51
20:51